Hi Ronald, This strategy is about "reverse trades" . we are looking for support (buy) and Resistance (Sell). But you need to have different TF to understand the trends...
Ignored
I think the ordinary system is just like that " When near support we buy and near resistance we sell" so what do you mean by "reverse your trade" ? thanks for your explanation
Maybe i am wrong, but it looks as though you are doing what everyone else does trading off the bounce of sup/dem. Why don't you wait for a sup/dem to be broken and trade the momentum after it, then you will be trading opposite most traders or reverse trading.
jt
"Even if you fall down face first, you still went forward."
latest GBP/JPY chart looking for entry SELL....SL 123.75. Resistance is too hot. BE or TP15pips. We trade 1 standard lot!!!!
Note : Once Support and Resistance is too close..You may choose to stay out till break-out.
TP!!!!!!TP!!!!!!!TP!!!!!!! DONE!
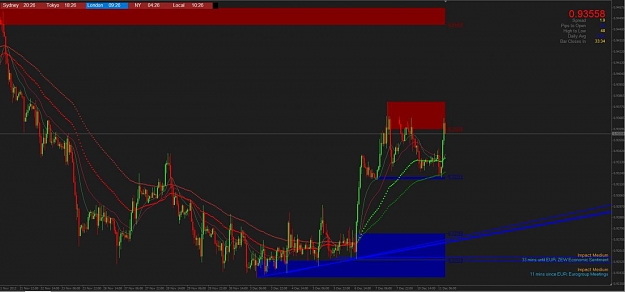
Latest AUD/USD chart..looking for entry "SELL" if no break above 1.0517. Happy Pips!!
Simple, easy and powerfull System that make you a PROFITS Trader soon. Best wishes to all!
Do you wait for a rejection of a S&R level on the 1hr TF before entering the trade? Example, say buy area is 1.3000. Do you wait to see if the 1hr candle will close below it first and if it fails to low it, you then enter a buy?
Hi BJ1, Yes, We normally wait for few bounces around our example level of 1.3000(Support "BLUE level" for BUY or resistance "RED level" as SELL).
Sometime..It bounce and move on...Do not Chase after it!!!!!! There is alway trades for everyone.
Happy Trading!!!
Do you wait for a rejection of a S&R level on the 1hr TF before entering the trade? Example, say buy area is 1.3000. Do you wait to see if the 1hr candle will close below it first and if it fails to low it, you then enter a buy?
Latest trade for the day...GBP/JPY chart ....looking to "SELL".
NOTE : Remember your SL(Stop Level133.465) too! since GBP/JPY alway spike!!!! beware!!! guys. Happy Pips.
latest GBP/JPY chart looking for entry SELL....SL 123.75. Resistance is too hot. BE or TP15pips. We trade 1 standard lot!!!!
Note : Once Support and Resistance is too close..You may choose to stay out till break-out.
TP!!!!!!TP!!!!!!!TP!!!!!!! DONE!
Ignored
Good evening. What you've mentioned is how I ACTUALLY trade. I have attached one of my accounts here for you to see the results and how I do it. I simply use pending orders to catch the reversals when they occur. The most important part of trading that way is to realize you have no bias towards any direction. You're simply allowing price action to grow your account.