What day did his mother wish he was born? That's only one of many clews.
I have never found any mention of fib in his works other than the possible references in the human body
His secret?
Ignored
she wished robert would born on sunday. But he was born on late saturday night. I still dont have an idea about how to decode this. So could you please give some more help?
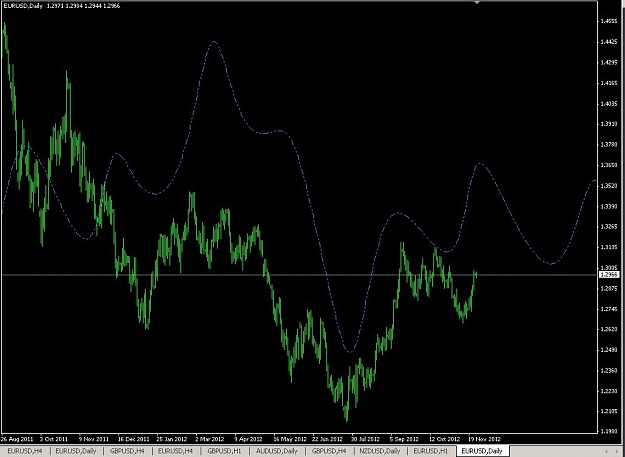
This is one way to read market from declinations (Actually Heliocentric Latitude). Green line is the weighted total of the first six planets (M, V, E, M, J, S) of our solar system. Blue line is a fictitious line connecting their midpoints. This blue line can be used as a long term cycle for markets. As seen for Eur/Usd it sometimes inverses and often this inversion is cyclic too. As seen from the chart for Eur/usd this occurs after every 4 top and bottom. According to this cycle we just had a bottom after inversion and low readings of our blue line would bring us higher prices and until the end of 2012 we may reach another top.
This is one way to read market from declinations (Actually Heliocentric Latitude). Green line is the weighted total of the first six planets (M, V, E, M, J, S) of our solar system. Blue line is a fictitious line connecting their midpoints. This blue line can be used as a long term cycle for markets. As seen for Eur/Usd it sometimes inverses and often this inversion is cyclic too. As seen from the chart for Eur/usd this occurs after every 4 top and bottom. According to this cycle we just had a bottom after inversion and low readings of our blue line...
Not sure he weighted them but if I was to I would use ratio of planetary periods. Try both approaches
Ignored
If you want to know which planets are working together you need to look at their symbols. Those were not just pulled out of the thin air, they are carefully selected according to the LOV.
I wrote Helio latitude sum indicator. Thanks Almondeyed for idea.
Not sure if everything is correct.
Below is screenshot.
I include planets from Mercury till Pluto, every planet has the same weight.
Indicator will reach its peak on November 29, at night.
So we are in reversal time zone.
I see some planetary resistance at 1.3 and also at 1.3020, 1.3040
-------------------------------- www.fx-analysis.com
This is one way to read market from declinations (Actually Heliocentric Latitude). Green line is the weighted total of the first six planets (M, V, E, M, J, S) of our solar system. Blue line is a fictitious line connecting their midpoints. This blue line can be used as a long term cycle for markets. As seen for Eur/Usd it sometimes inverses and often this inversion is cyclic too. As seen from the chart for Eur/usd this occurs after every 4 top and bottom. According to this cycle we just had a bottom after inversion and low readings of our blue line...
Good idea Almondeyed. I will try this and write my impressions.
Earlier I wanted to program Bradley but this requires too much time.
Ignored
What i used much simpler than Bradley... No good bad aspect difference or no declination.. I especially did this. Good aspect can be good for euro and bad for usd or vice versa So better only to concentrate on number of aspects.. Instead of declinations i want to add number of max decl south&north, 0 degree passes and parallels ... By the why i cannot post its chart but i tried Bradley and it really looks good to find turning points anyway
Quote
Disliked
Hello,
I wrote Helio latitude sum indicator. Thanks Almondeyed for idea.
Not sure if everything is correct.
Below is screenshot.
I include planets from Mercury till Pluto, every planet has the same weight.
Indicator will reach its peak on November 29, at night.
So we are in reversal time zone.
I see some planetary resistance at 1.3 and also at 1.3020, 1.3040
I don't know about weights.. I don't think it is logical to give same wights to Jupiter and Pluto who is no more planet
fx-analyst Looks pretty good When index peak don't bring price peak half points or 1/3 points bring peaks i think
Edit: BTW this geocentric not heliocentric
LOV is in the air
everywhere i look around
LOV is in the air
in every sight and every sound
Ignored
The rest of it is pretty good as well :
And I don't know if I'm being foolish
I don't know if I'm being wise
But it's something that I must believe in
And it's there when I look in your eyes.
LOV is in the air, in the whisper of the trees,
LOV is in the air in the thunder of the sea,
And I don't know if I'm just dreaming,
I don't know if I feel safe,
But it's something that I must believe in
And it's there when I call out your name.
Love is in the air, love is in the air, oh, oh, oh, oh, uh,
Uh, uh, uh.
LOV is in the air, in the rising of the sun,
LOV is in the air, when the day is nearly done,
And I don't know if you are illusion,
Don't know if I see truth,
What i used much simpler than Bradley... No good bad aspect difference or no declination.. I especially did this. Good aspect can be good for euro and bad for usd or vice versa