So, it seems that 129 was the new top. (so far). If history repeats, we'll be back at 129 in a day or so, as per April 24 2012
Ignored
I don't know, my view is that fundamentals are quite different. I wouldn't be surprised if it will try and actually brake the Trendline, probably not today, but everything is possible.
I don't know, my view is that fundamentals are quite different. I wouldn't be surprised if it will try and actually brake the Trendline, probably not today, but everything is possible.
Ignored
One of the more memorable comments made to me about fundamentals was when GJ sat at about 131.5 back in April. I suggested that it would fall to around 119 and be stopped by a particular trendline. Someone replied that there was no "fundamentals" reason for it to drop at all, let alone that far.
A month later it had arrived at 119.
Not saying you're wrong, just that things have a habit of changing.
By example .... Today's moves were instigated by comments from the Japanese opposition leader. Everyone thinks he will win the December election and ensure that BOJ take stronger action to further weaken the currency.
Today's moves were instigated by comments from the Japanese opposition leader. Everyone thinks he will win the December election and ensure that BOJ take stronger action to further weaken the currency.
What happens if he actually doesn't win?
Ignored
But there was a clear technical reason to drop back then. I know, we are fighting the same Trendline again...But before Price shoot up abruptly and needed 9 weeks to get to the Trendline, now it needed 23 weeks, it's persistent up.
Japanese companies are really hurt by the strong yen, using and mostly already used reserves they gathered for years. Japan actually has to do something. Devil took the joke.
What happens if he doesn't win? That depends on the rhetoric and plan of the guy who will win. What if he will be even tougher?
It is the second time in some 255 weeks that on Weekly chart 20 EMA crosses the 53 EMA. I know, I know, it means jack shit and is hilarious, but seriously, looking at the chart Price is picking up from the bottom slowly.
It is the second time in some 255 weeks that on Weekly chart 20 EMA crosses the 53 EMA. I know, I know, it means jack shit and is hilarious, but seriously, looking at the chart Price is picking up from the bottom slowly.
Ignored
You might be right, already sold my long from 125.74 a little too early at 128.10, If I were to trade this bullishness now is not the right time to buy, there is more reward if I sell in to this bullishness unless it breaks the major trendline we are all talking about.
You might be right, already sold my long from 125.74 a little too early at 128.10, If I were to trade this bullishness now is not the right time to buy, there is more reward if I sell in to this bullishness unless it breaks the major trendline we are all talking about.
Ignored
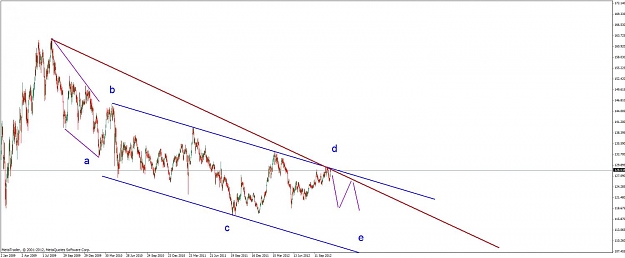
The fact is one day it will have to be broken or it will eventually hit the parity. What if brake happens tomorrow or next week, what will be the levels? 131 as a possible upper Trendline of suppose to be Bullish channel, price descents down to this trendline and test it? If test ok, then what? 133-134-135 area and multiple weeks consolidation before new trend is decided?
The fact is one day it will have to be broken or it will eventually hit the parity. What if brake happens tomorrow or next week, what will be the levels? 131 as a possible upper Trendline of suppose to be Bullish channel, price descents down to this trendline and test it? If test ok, then what? 133-134-135 area and multiple weeks consolidation before new trend is decided?
Ignored
When that day comes we will be there to collect more pips, as of the time being I am waiting for confirmation and enjoy my pips in the bag. What will you do?
When that day comes we will be there to collect more pips, as of the time being I am waiting for confirmation and enjoy my pips in the bag. What will you do?
Ignored
Well I am trying to figure out the plan I think I might babysit charts tomorrow. I have multiple longs, from 125.76, 126.4, 127.81 ...
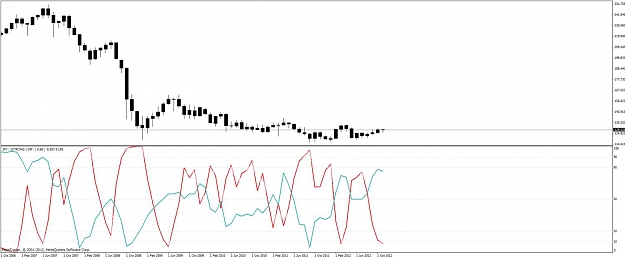
I realise that some of you folks only use certain moving averages or trendlines in what you do, but for others who obviously have a morbid desire to trade GBPJPY, I thought I would offer a Yen strength indicator that I came across about 2 years ago on another forum. It was being used with a robot to trade against varying Yen strength at certain times of the day. The project went away, but this indicator was a crucial part of the setup.
It requires a lot of interpretation to use, but when you get to know it, it gives you a very clear idea as to when price on different timeframes is strong or weak. The chart below shows this strength indicator (red) in conjunction with the CCI (green) on a monthly chart. You just tell it what Yen pair you're trading.
I realise that some of you folks only use certain moving averages or trendlines in what you do, but for others who obviously have a morbid desire to trade GBPJPY, I thought I would offer a Yen strength indicator that I came across about 2 years ago on another forum. It was being used with a robot to trade against varying Yen strength at certain times of the day. The project went away, but this indicator was a crucial part of the setup.
It requires a lot of interpretation to use, but when you get to know it, it gives you a very clear idea as to...
Ignored
OK, so I put it on the Daily, and levels for that indy are down. So am I wrong to assume that indy is telling me to SELL? Buy?
I am just asking...
OK, so I put it on the Daily, and levels for that indy are down. So am I wrong to assume that indy is telling me to SELL? Buy?
I am just asking...
Ignored
OK, on the daily you'll see it at the bottom, but about to turn up. It's a bit inverse to the way we think, but indicator going up means price will go down. And vice versa. Look at the hour. Its pointing up now, also meaning a drop is happening.
Why I like this indicator is that it's very fast, unlike stochastics et al.
But it does not always say sell or buy. Sometimes price will just consolidate and work out its strength
Ignored
And you have to switch between different time frames to get a good overview at any one time. I use it against the CCI, as a large difference between those two will usually indicate a real move coming up for that TF.
I would have expected something by now. But it seems to be very busy. I suspect it's busy making friends with its new-found buddy, the RED trendline. I hope it likes red!!
Kinda OT, but I have been changing my candle colors to either all blue, or the up are red and down green.
It's to reinofrce the sell hi, buy low, seems the "standard" colors are taught to make it harder to do what you need to do.....
Ignored
Mate, do whatever feels right and works for you.
...and this possible RED TL keeps being tested and rejecting. If it's real, this would be the first time in about 3 years that a GJ TL has been moved DOWN and not UP
Or we might see a BSDM movie. Touched gently until raped. I admit, it would be crazy to cross the Trendline, people will not know anymore how to trade. We'll have to redraw the charts... Unthinkable!!
Or we might see a BSDM movie. Touched gently until raped. I admit, it would be crazy to cross the Trendline, people will not know anymore how to trade. We'll have to redraw the charts... Unthinkable!!
Ignored
There's always a plan B. But, yes, it would throw about a year of analysis out the door ... or at least call for a modification