I have been exploring indicators that make steps on the price chart. SO far, I have only found three that have potential. By themselves, two of them (stepChart and Non-lagMA) can look very interesting on the chart "until" you actually walk the chart and make the calculations. Then, what looked great to the eyes shows itself as a disaster zone. The third (HAS) can and does work but this method may enhance it greatly.
What makes the difference in using them, is "how" you manage the stops.
I have tried trend lines and gotten knocked out way too early
Tried moving the trend line stop from step to step (origin point not changing but slope end changes with each step)
Tried using filters but failed. (they all seem to agree in a way that doesn't help or just plain looked like spaghetti to me)
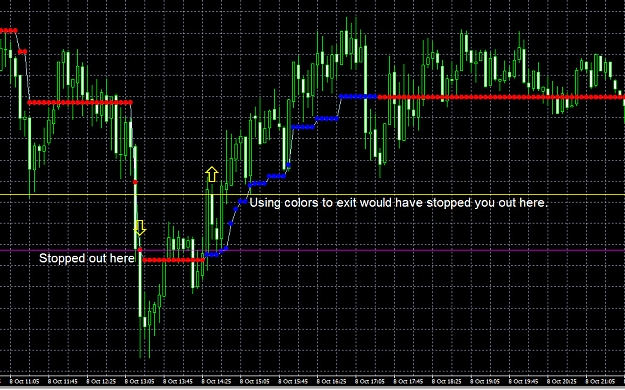
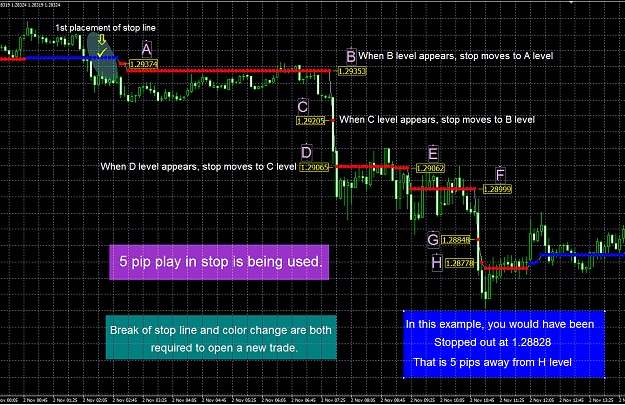
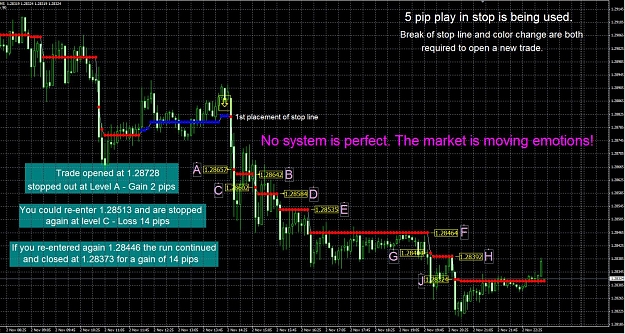
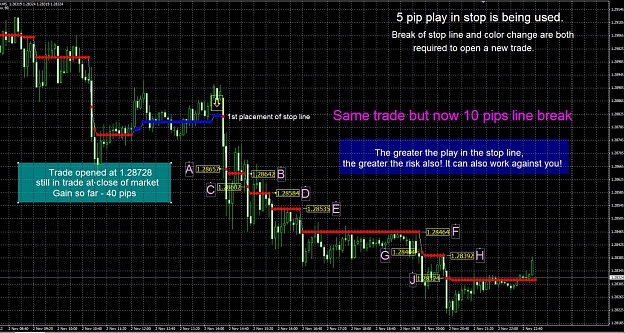
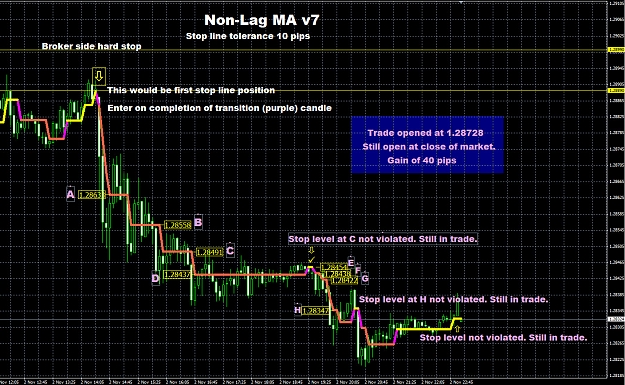
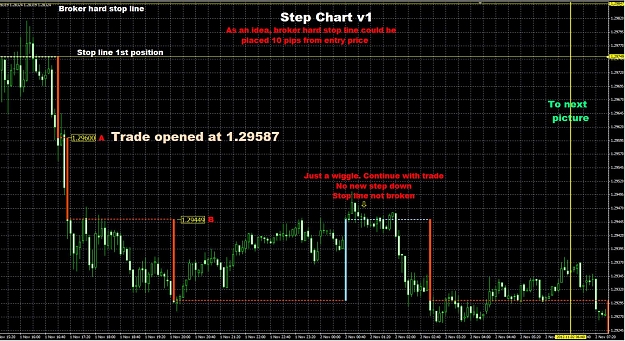
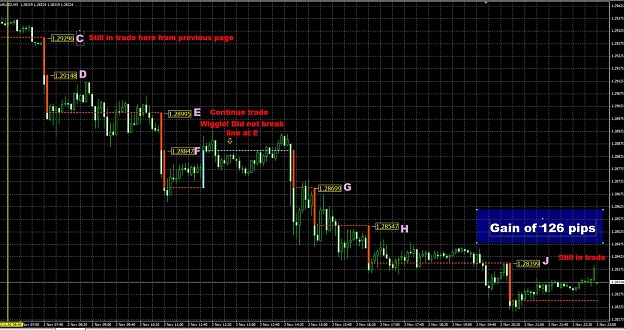
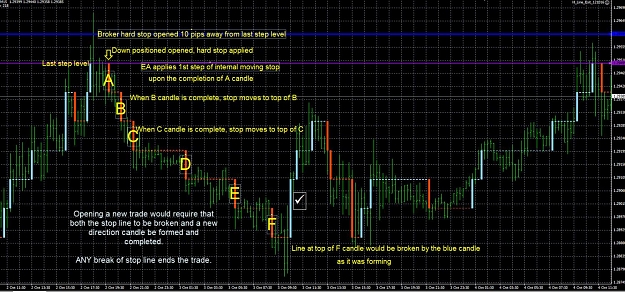
Then I tried something that almost seems absurd. Instead of using a trend line, I applied a horizontal stop line that would move. Suddenly, that which was a disaster waiting to happen, started to show a lot of potential. The method appears to have safety and the ability to capture the most it can without giving away more than necessary. The exit rules tend to keep you in the trade during wiggles.
The picture will explain it best. Though there is only one picture, I think you will get the idea of how to apply it to the other indicators.
I would ask, that we all be tolerant and considerate. We were all new at this at one time and asked some seemingly stupid questions. Let's make this thread welcome to all levels of knowledge. Sometimes, the best ideas come from looking at things in a strange way that may not seem logical at first.
What makes the difference in using them, is "how" you manage the stops.
I have tried trend lines and gotten knocked out way too early
Tried moving the trend line stop from step to step (origin point not changing but slope end changes with each step)
Tried using filters but failed. (they all seem to agree in a way that doesn't help or just plain looked like spaghetti to me)
Then I tried something that almost seems absurd. Instead of using a trend line, I applied a horizontal stop line that would move. Suddenly, that which was a disaster waiting to happen, started to show a lot of potential. The method appears to have safety and the ability to capture the most it can without giving away more than necessary. The exit rules tend to keep you in the trade during wiggles.
The picture will explain it best. Though there is only one picture, I think you will get the idea of how to apply it to the other indicators.
I would ask, that we all be tolerant and considerate. We were all new at this at one time and asked some seemingly stupid questions. Let's make this thread welcome to all levels of knowledge. Sometimes, the best ideas come from looking at things in a strange way that may not seem logical at first.
Attached Image (click to enlarge)
Attached File(s)