WOW,
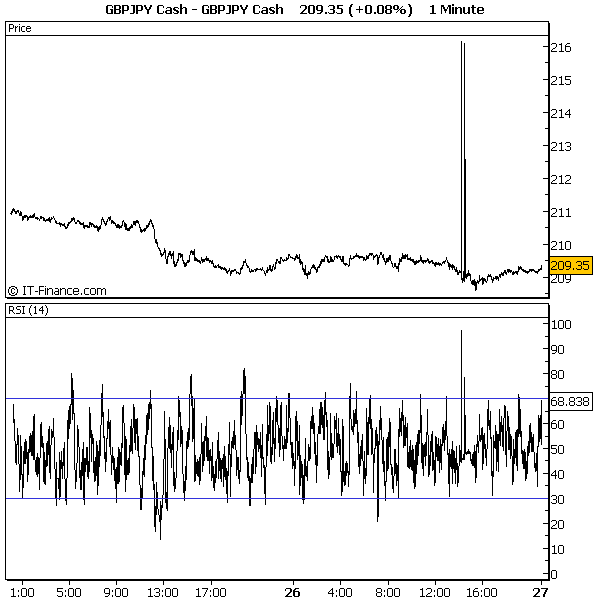
What the heck is going on?
13:13GMT the (1M) chart printed the following:
Open: 209.15
High: 212.75
Low: 209.09
Close: 212.64
(a 366 pip move!)
13:15GMT the (1M) chart printed the following:
Open: 212.60
High: 212.65
Low: 208.90
Close: 208.99
(a 361 pip move!)
13:31GMT the (1M) chart printed the following:
Open: 208.98
High: 212.65
Low: 208.93
Close: 212.60
(a 372 pip move!)
13:32GMT the (1M) chart printed the following:
Open: 212.60
High: 212.66
Low: 209.04
Close: 209.11
(a 356 pip move!)
Has anyone ever seen anything like this before? These were from my live account on FXDD. I checked a demo account on another broker's site and I did not see anything out of the ordinary.
Man, talk about the most significant STOP HUNT ever!!!
Alan