Hi there,
I am a discretional trader, and cannot complain, I've managed to double my account few times by now. After a while trading currencies, I have been working in the automation of my strategy in order to open a PAMM account (kind of tired of being glued to the monitor).
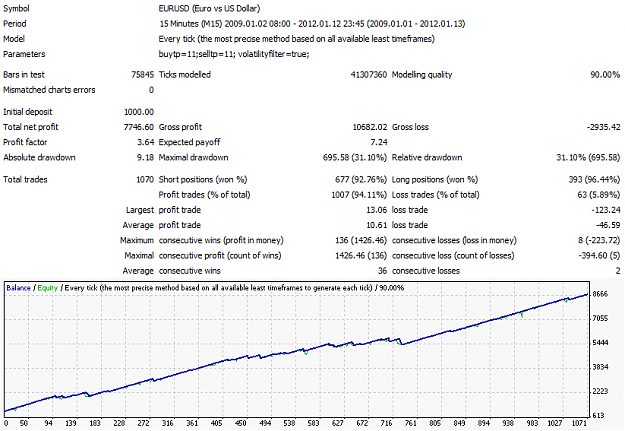
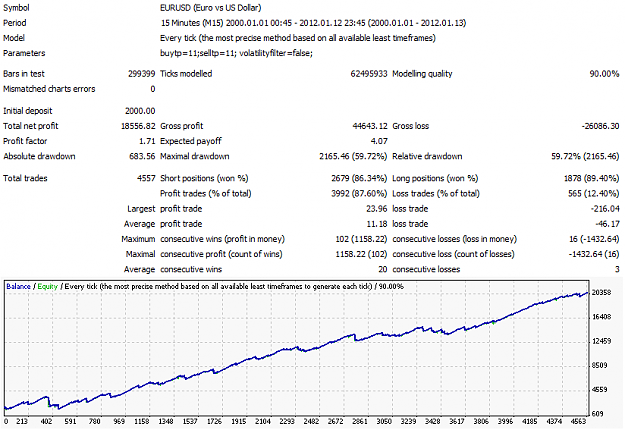
I have past few months coding (quite a bit) this strategy and finally came to a very analytical study of price action. The results were very good for the last year (2011), so I tried a couple years back, and got the picture you see bellow from 2009 to 2012. After that, I went to 2006 and then 2000 to see what happens. Well, I found that in fact, the strategy is very consistent and survived the internet crash of 2000 and the mortgage crash in 2008 with minor scratches. And as you can see, the worst drawdown was in 2000 where it experienced a 59% DD; right after the internet crash, the system recovered the losses and resumed its way.
As everything, there is only one detail, and is that I still have not managed to test it for this year 2012 in 1 minute timeframe, since Metatrader only downloads historical data until 1/13/2012 for 1 minute. And the current data you see on charts, are only 1 month back for that timeframe, so I have no data from 1/13 to 8/1/2012.
Now, if there is anyone who could please find for me historical data of 1 min for this year 2012 (from live ECN account, as you may know, I cannot use demo data nor bucket shops data), I would really appreciate it. I have tried to find historical data out there, but with not too much luck, most of it are corrupted, incomplete or not accurate enough. So, I decided to write a post here to see if there is anybody who has this data available.
Well, I think that's all by now.
Thanks in advance guys.
I am a discretional trader, and cannot complain, I've managed to double my account few times by now. After a while trading currencies, I have been working in the automation of my strategy in order to open a PAMM account (kind of tired of being glued to the monitor).
I have past few months coding (quite a bit) this strategy and finally came to a very analytical study of price action. The results were very good for the last year (2011), so I tried a couple years back, and got the picture you see bellow from 2009 to 2012. After that, I went to 2006 and then 2000 to see what happens. Well, I found that in fact, the strategy is very consistent and survived the internet crash of 2000 and the mortgage crash in 2008 with minor scratches. And as you can see, the worst drawdown was in 2000 where it experienced a 59% DD; right after the internet crash, the system recovered the losses and resumed its way.
As everything, there is only one detail, and is that I still have not managed to test it for this year 2012 in 1 minute timeframe, since Metatrader only downloads historical data until 1/13/2012 for 1 minute. And the current data you see on charts, are only 1 month back for that timeframe, so I have no data from 1/13 to 8/1/2012.
Now, if there is anyone who could please find for me historical data of 1 min for this year 2012 (from live ECN account, as you may know, I cannot use demo data nor bucket shops data), I would really appreciate it. I have tried to find historical data out there, but with not too much luck, most of it are corrupted, incomplete or not accurate enough. So, I decided to write a post here to see if there is anybody who has this data available.
Well, I think that's all by now.
Thanks in advance guys.
Attached Image (click to enlarge)
Attached Image (click to enlarge)