First and foremost find out very important areas like Support and Resistance ,
RN , BRN , EMAs
More confluence of the factor better the area it is .
Before trading always look for bigger picture With Top to Bottom Approach ( Higher time frame to lower time frame ) .
Now look for the actions around those areas ,( PASR- Price Action AT Support and Resistance )
Pinbars , Inside/Outside bars , Two bar reversals and always follow the rule posted on Page no 1.
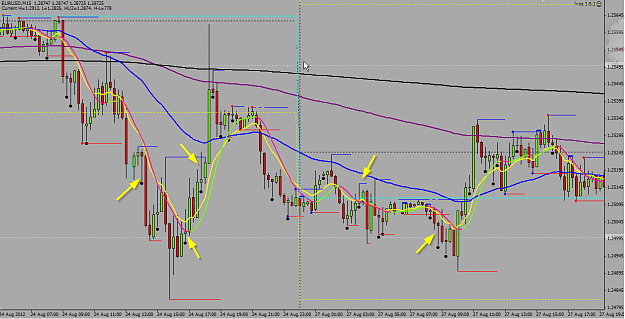
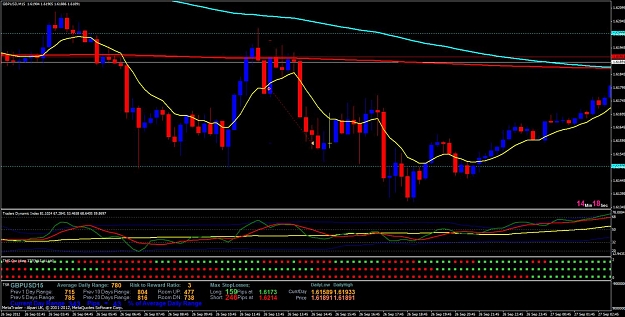
Tango here is my thought on the pin bars you have marked with yellow arrows. If I would have chose to trade those pins I would have only traded them in the direction of the 10ema which means they would have all went in my direction except arrow number 2. The only way to avoid 2 from just looking at that chart is by waiting for some type of down move or looking to 5 or 1 minute time frame for confirmation. The confirmation would have never came. I hope I understood what you were asking and this helps.
First and foremost find out very important areas like Support and Resistance ,
RN , BRN , EMAs
More confluence of the factor better the area it is .
Before trading always look for bigger picture With Top to Bottom Approach ( Higher time frame to lower time frame ) .
Now look for the actions around those areas ,( PASR- Price Action AT Support and Resistance )
Pinbars , Inside/Outside bars , Two bar reversals and always follow the rule posted on Page no 1.
Tango here is my thought on the pin bars you have marked with yellow arrows. If I would have chose to trade those pins I would have only traded them in the direction of the 10ema which means they would have all went in my direction except arrow number 2. The only way to avoid 2 from just looking at that chart is by waiting for some type of down move or looking to 5 or 1 minute time frame for confirmation. The confirmation would have never came. I hope I understood what you were asking and this helps.
Hello fxbloom,
My first post on this thread. (Thanks LE1 for this wonderful thread and the spirit that you keep here.)
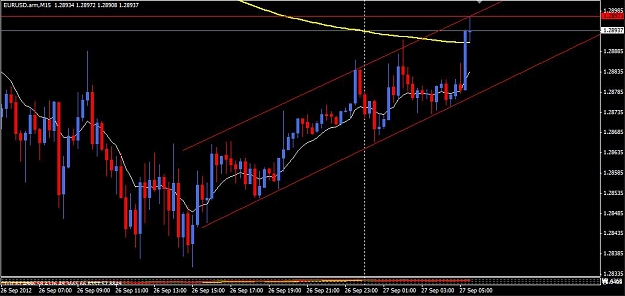
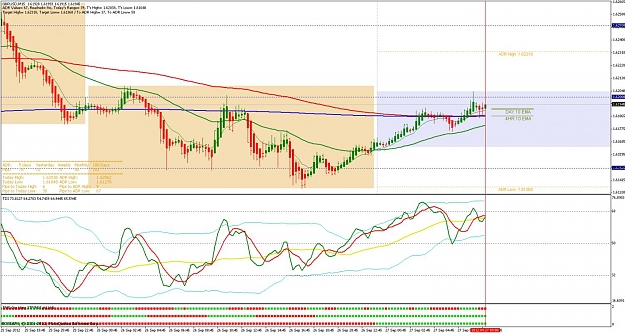
No, it's not a bad signal. After the signal, price bounced along the Daily Pivot which is also Today's Open. And just below those two are the H1 10ema and the 15m 50ema.
The general rule is not to trade before Frankfurt and London Opens as volumes can be low and so price action can be "twitchy".
Kan
Thanks for your help, warmth and straight talking Heather.
I'm curious, your TDI green has spiked over the 68 level a couple of candles ago, but mine hasn't. Have you changed your settings? (Mine is left at default)
I'm blind today....cant see anything clearly,....i think i got to take some rest....MIND is not good...coz i dont see any potential setup.will see you guys....need to practice my eyes...
And i'm going to start another thread on 5mn very soon...only experienced traders are allowed to post to post there....
i have been working on that for a while ....lets see how that goes....
I request all the newbies to stick to 15mn TF....coz you folks have no idea on how the price moves on 5mn.....everyone here trades 15mn there is no change but the entry are just shown on the 5mn chart...thats all...do not put all the junk on your chart and confuse youself....
Apologies if it is in another post and I've missed it, I have looked but with over 500 pages now, it is a needle in a haystack task, but could someone please post the indicator that displays the current 10EMA as flat horizontals for the various longer tf's on the right hand side of the chart.
Apologies if it is in another post and I've missed it, I have looked but with over 500 pages now, it is a needle in a haystack task, but could someone please post the indicator that displays the current 10EMA as flat horizontals for the various longer tf's on the right hand side of the chart.