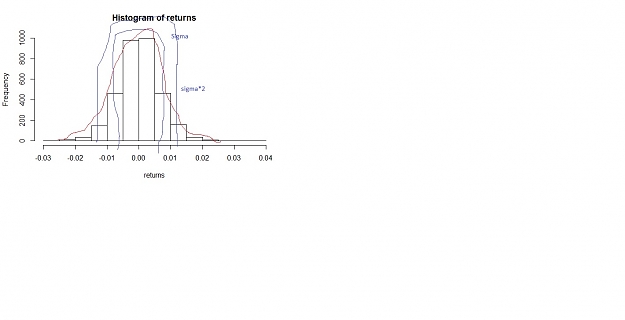
The Euro/Usd returns using formula (todays close- prev close)/prev close over a sample of 3,304 looks like bell shape curve with heavy tails. It is interesting to point out that it is skewed slightly to the right as the net returns is not =0 the mean of the curve is -.08284% with standard deviation of 0.6596%.
Sigma*2 would be 1.32%.
It is pretty late here but my interpretation of this data roughly is that the Eur/Usd historically acts as a normal distribution favoring euro strength slightly not only in its heavy tails but also where the mean is centered. so if I was to come up with a strategy then I could very well assume that the probability of close below open is roughly 50%.
Historically returns unchanged in 3304 trading days is 36 where the net return was 0%.
positive returns 1666
negative 1602
which makes 50.42% that the Euro has closed above open since inception.
(I understand the limitation of historical statistics as past events cannot predict future information or future macro economic variables that can move this pair however historical stats is can be a good base)
so where am I going with this..... the market distribution and actions are random like and can be exploited using the volatility of this pair using a system with positive mathematical expectation
as it is shown here the Range of the pair is (in pips)
min 1st mean 3rd max
0 78 120.6 148 538
basically the IQR is from 78 to 148 is what we can expect the daily high-low movement or range of this pair .....this is important as our targets need to be calculated accordingly.
now the quantile 5% is 49 pips and the quantile 95% is 232 pips
so in a market where the probability of bullish days are about the same as the bear days with a mean range of 120 with 95% confidence that the range is expected to travel 49 at the least and 232 at the most.
our targets can be either 60:60 where our overall expectancy is 0
or 50/60 where our expectancy is 16.67%
50/70 or 60/70 keeping in mind that although intuitively we might want to keep our t/p higher than our s/l doing so actually increases the probability of the market stopping us out as the 50/70 might not be as easily filled to our t/p as the 50/60.
now the formula for standard deviation of random events is (p(1-p)p/n)^1/2
assuming independence then we can compute p=.5 and n=240 (as 5 days x 4 weeks in a month x 12 months is 240).
2.28% is our standard deviation in one year of trading, meaning if it was purely random then 50%-2.28% or 50%+2.28% we stand to lose or gain about
a winning year with win loss of 52.28% keeping our targets as calculated
and a losing year 47.72%
as to have in a winning year net positive of 1,255 pips *(lot size)
and in a losing year 1,145 pips *(lot size)
of course the heavy tails and human error is not factored in.
Sigma*2 would be 1.32%.
It is pretty late here but my interpretation of this data roughly is that the Eur/Usd historically acts as a normal distribution favoring euro strength slightly not only in its heavy tails but also where the mean is centered. so if I was to come up with a strategy then I could very well assume that the probability of close below open is roughly 50%.
Historically returns unchanged in 3304 trading days is 36 where the net return was 0%.
positive returns 1666
negative 1602
which makes 50.42% that the Euro has closed above open since inception.
(I understand the limitation of historical statistics as past events cannot predict future information or future macro economic variables that can move this pair however historical stats is can be a good base)
Attached Image (click to enlarge)
so where am I going with this..... the market distribution and actions are random like and can be exploited using the volatility of this pair using a system with positive mathematical expectation
Attached Image (click to enlarge)
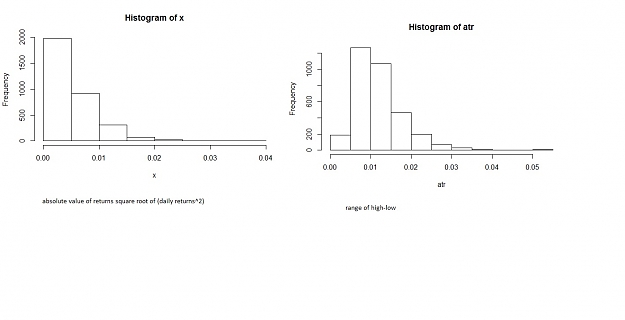
as it is shown here the Range of the pair is (in pips)
min 1st mean 3rd max
0 78 120.6 148 538
basically the IQR is from 78 to 148 is what we can expect the daily high-low movement or range of this pair .....this is important as our targets need to be calculated accordingly.
now the quantile 5% is 49 pips and the quantile 95% is 232 pips
so in a market where the probability of bullish days are about the same as the bear days with a mean range of 120 with 95% confidence that the range is expected to travel 49 at the least and 232 at the most.
our targets can be either 60:60 where our overall expectancy is 0
or 50/60 where our expectancy is 16.67%
50/70 or 60/70 keeping in mind that although intuitively we might want to keep our t/p higher than our s/l doing so actually increases the probability of the market stopping us out as the 50/70 might not be as easily filled to our t/p as the 50/60.
now the formula for standard deviation of random events is (p(1-p)p/n)^1/2
assuming independence then we can compute p=.5 and n=240 (as 5 days x 4 weeks in a month x 12 months is 240).
2.28% is our standard deviation in one year of trading, meaning if it was purely random then 50%-2.28% or 50%+2.28% we stand to lose or gain about
a winning year with win loss of 52.28% keeping our targets as calculated
and a losing year 47.72%
as to have in a winning year net positive of 1,255 pips *(lot size)
and in a losing year 1,145 pips *(lot size)
of course the heavy tails and human error is not factored in.
AVT INVENIAM VIAM AVT FACIAM