Introduction
Support and Resistance levels are probably the most popular method of financial markets analysis and decision-making instrument.
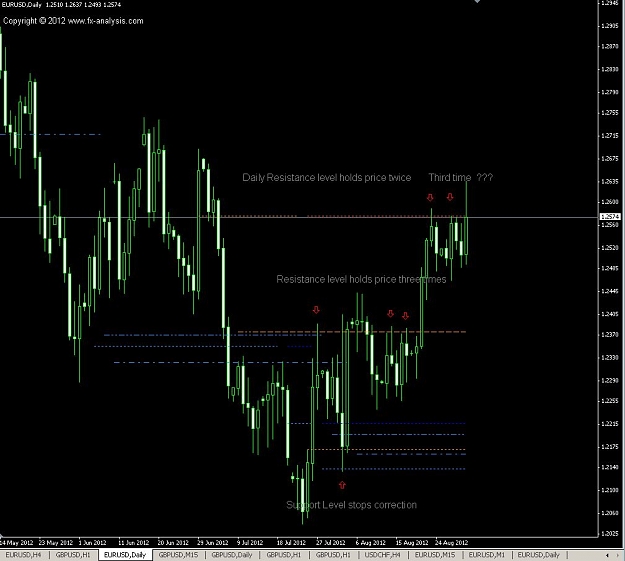
If identified correctly, support and resistance levels allows trader to minimize loss and maximize profit.
There are many methods of calculating support/resistance lines.
Perhaps most popular is to consider previous high as resistance and previous low as support. Contrary method also exists - previous high as support, previous low as resistance (if market has strong trend).
Fibo levels and Gann lines are other popular methods.
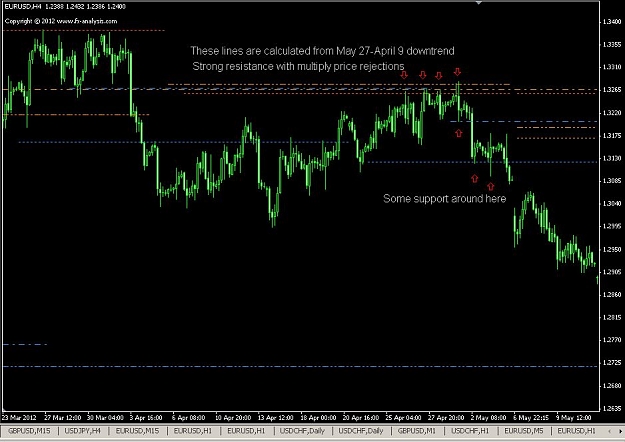
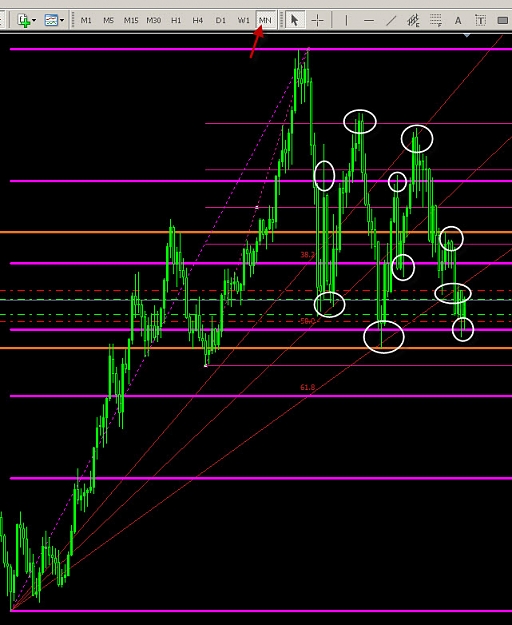
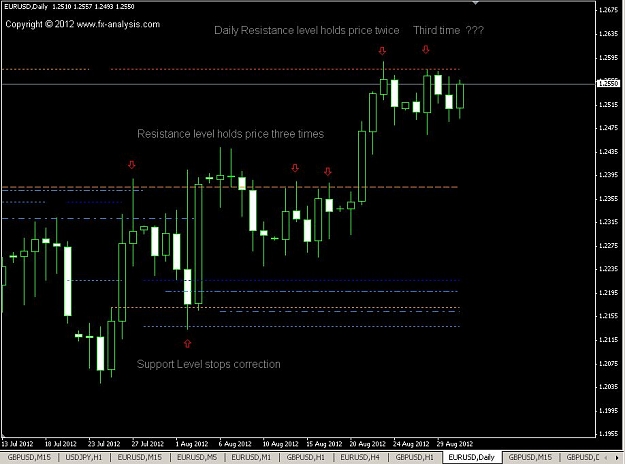
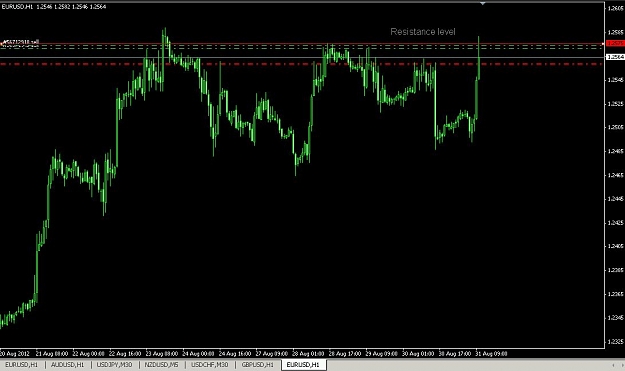
While observing markets and working with various mathematical methods I discovered very different method to callculate support and resistance levels. These levels depends not only of absolute high or low (as classic method or Fibonacci), but also depends of trend slope, trend duration and trend patterns (expecially important how tops and lows are formed).
FX-Analyst
Support and Resistance levels are probably the most popular method of financial markets analysis and decision-making instrument.
If identified correctly, support and resistance levels allows trader to minimize loss and maximize profit.
There are many methods of calculating support/resistance lines.
Perhaps most popular is to consider previous high as resistance and previous low as support. Contrary method also exists - previous high as support, previous low as resistance (if market has strong trend).
Fibo levels and Gann lines are other popular methods.
While observing markets and working with various mathematical methods I discovered very different method to callculate support and resistance levels. These levels depends not only of absolute high or low (as classic method or Fibonacci), but also depends of trend slope, trend duration and trend patterns (expecially important how tops and lows are formed).
FX-Analyst