I started this thread to present a formal approach to developing trading systems. I am currently a successful trader, but as for the future - who knows. Anyway because of my background I’ve been able to put together an approach to developing trading systems that is serving me very well. I should point out that what I’m presenting here is a method - I’m not about to divulge how I have used the method to build successful trading systems (for now at least anyway).
Every system has two crucial components - the inputs and the outputs.
Inputs are the indicators/price patterns/formulae/price data that you believe have some predictive power. And lets get something straight about the word predictive - it is synonymous with probable. People get hung up on semantics - the word predictive means probable.
If you believe that indicators have predictive power then those will be your inputs. If you are a price action trader then maybe inside bars etc. If you are using inter-market analysis then other instrument prices will be used - and so on. No matter what your approach you have a set of inputs - even if it is something as intangible as intuition.
Outputs are more interesting in many ways. Most people just want a system that has a net pip gain. But other outputs are equally as important. How big is the drawdown? How long does it typically last? How straight is the equity curve (sharp ratios etc)? How big are the stops? - and so on. If you are manually creating a trading system it becomes very difficult to estimate more that a couple of outputs - for that reason I use several software packages to do the donkey work.
Next we come to the mechanics of using historical data. You must split the data into two parts. The first, and largest part is the training data set. So say we have 20 years of daily bars. We might use the first 15 years (1990 - 2004 say) to train the system. No matter whether you build your systems manually or using software the principle is the same. You tweak parameters, modify the patterns you are looking for, change indicators and so on until you find something that works. All trading systems are based on this principle whether you are a price action trader or using neural networks. The problem is that we home in on a set of inputs that work for the data set we are looking at - but does it have general application or is it just a curve fit? Have we tweaked until we’ve made it work just for the training data set?
This is where the last five years of the data comes in handy. The test set, as it is often called (or out-of-sample data) is then used to see if the system built using the training data still works on price bars that have not been seen before. If it does you can be fairly confident that the system is viable. But be warned, many systems built using the training set will fail on the test set. But at least you will not start trading a duff, curve fitted system.
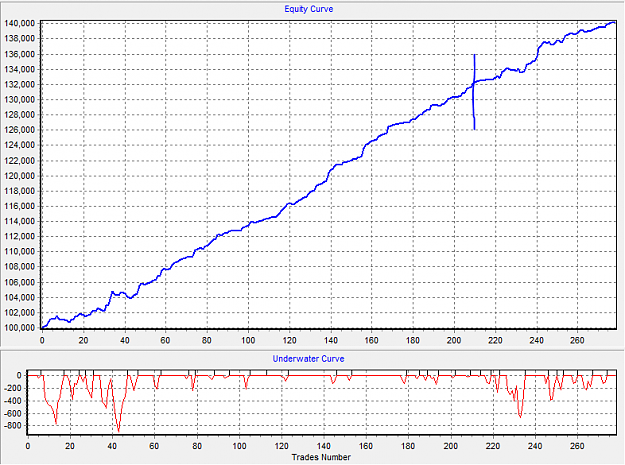
I only trade daily bars simply because I do not want to watch a screen all day. Below is the equity curve for the GBPUSD - and this is one of twenty systems I trade. The last 20 trades (about 10 months) are live trades I have taken - profitably, as the curve shows. The verical line on the equity curve divides the testing data set from the training data set (the largest part).
This is a mechanical approach to trading - I am hopeless at discretionary trading, and so I know that some will find this over-formal - but it works for me and may be of help to others. And just one other thing. Let your imagination soar when it comes to considering inputs and outputs - none of the usual stuff worked for me.
Every system has two crucial components - the inputs and the outputs.
Inputs are the indicators/price patterns/formulae/price data that you believe have some predictive power. And lets get something straight about the word predictive - it is synonymous with probable. People get hung up on semantics - the word predictive means probable.
If you believe that indicators have predictive power then those will be your inputs. If you are a price action trader then maybe inside bars etc. If you are using inter-market analysis then other instrument prices will be used - and so on. No matter what your approach you have a set of inputs - even if it is something as intangible as intuition.
Outputs are more interesting in many ways. Most people just want a system that has a net pip gain. But other outputs are equally as important. How big is the drawdown? How long does it typically last? How straight is the equity curve (sharp ratios etc)? How big are the stops? - and so on. If you are manually creating a trading system it becomes very difficult to estimate more that a couple of outputs - for that reason I use several software packages to do the donkey work.
Next we come to the mechanics of using historical data. You must split the data into two parts. The first, and largest part is the training data set. So say we have 20 years of daily bars. We might use the first 15 years (1990 - 2004 say) to train the system. No matter whether you build your systems manually or using software the principle is the same. You tweak parameters, modify the patterns you are looking for, change indicators and so on until you find something that works. All trading systems are based on this principle whether you are a price action trader or using neural networks. The problem is that we home in on a set of inputs that work for the data set we are looking at - but does it have general application or is it just a curve fit? Have we tweaked until we’ve made it work just for the training data set?
This is where the last five years of the data comes in handy. The test set, as it is often called (or out-of-sample data) is then used to see if the system built using the training data still works on price bars that have not been seen before. If it does you can be fairly confident that the system is viable. But be warned, many systems built using the training set will fail on the test set. But at least you will not start trading a duff, curve fitted system.
I only trade daily bars simply because I do not want to watch a screen all day. Below is the equity curve for the GBPUSD - and this is one of twenty systems I trade. The last 20 trades (about 10 months) are live trades I have taken - profitably, as the curve shows. The verical line on the equity curve divides the testing data set from the training data set (the largest part).
This is a mechanical approach to trading - I am hopeless at discretionary trading, and so I know that some will find this over-formal - but it works for me and may be of help to others. And just one other thing. Let your imagination soar when it comes to considering inputs and outputs - none of the usual stuff worked for me.
Attached Image (click to enlarge)
Irregular