Well its been a while since I posted a new thread. Well here I am finding myself trying to make better contribution.
A bit about me:
My intro to trading
I started trading forex a couple of years ago, after I realized that my daytrading stocks was minimal because of insufficient funds to trade unlimited roundtrips in the stock market. I quickly joined a trading forum/chatroom. I started learning all about trading, as much as I could. Free videos, Free Webinars, and free pump n dump stocks to say the least (I didnt even touch these, I was just here to learn the different instruments used to trade markets). Once I realized I did not have the minimum day trader status funds in my account. I did a bit more research and came accross Forex.
My Intro to forex
I started seeking out more about this forex. To make a long story short it brought me to babypips (I learned everything I needed to know about trading at the time from babypips). So I found out I could trade currencies with little money thanks to leverage.
My Forex trading experience
I ended up opening my first demo account. Did great on this till I realized that I was ready to open a new account about 3 months later (big mistake this was). I tried systems, all kinds of indicators, this, that, and a little of everything only to blow my account. Too much emotion, didnt understand about levereging properrly, and impatient. I opened another account a much bigger account $2K drew it down to about $700, then i built it back up to $2001K again and was so happy I thought I finally got the big picture. I repaired my account from $700 to $2K in less than a few weeks. Boy oh Boy, I though I was Mr. Hot Shit... lol; however a couple weeks later to my dismay I was humbled... I drew my account to $500 because I was cocky, overlevereged and overtrade. A total year and a half had gone by throughtout my trading forex to acheive loser status. Upset, furious, angry, spending 1000's of hours staring at charts, looking for the holy grail I couldnt come to grip with reality and my easily disillusioned trading.
Where trading took a turning point for the better for me.
After so much frusteration, I decided to get rid of indicators, emotions, and and decided to really see the market for what it really is. I had a buddy I was trading with via skype and we would share thoughts and ideas. Both of us were fed up at this point and I told him one day... Man I am done. I need a break for about a month and gather my thoughts and focus on how I was going to study charts and see what the market was really doing. Seeing throught the smoke and mirrors. My buddy agreed and said he was going to do the same thing. We kept in contact and tried to mentor each other. (I am a self tought trader and so was he. We never paid for training except for the money which we lost)... I studied, and studied PA, on FF, on the Internet and everywhere I could think of. I was ready to jump back into trading...
This is the end my friend
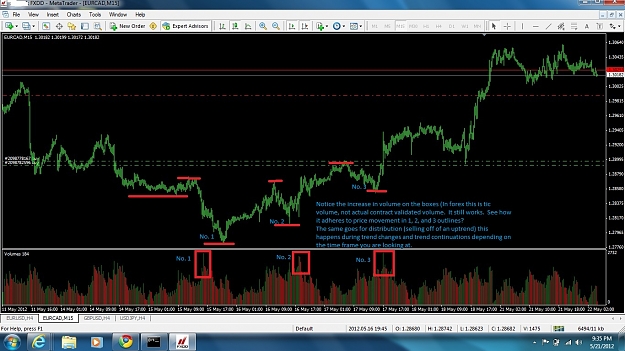
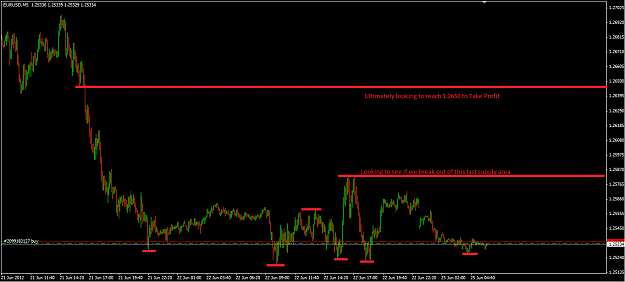
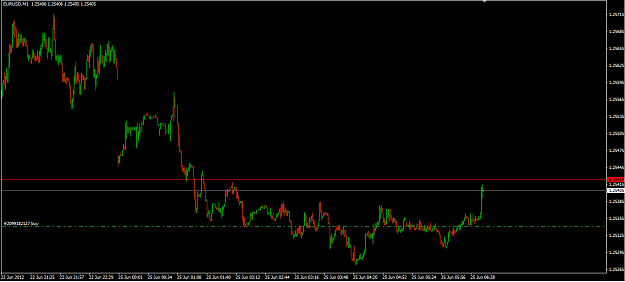
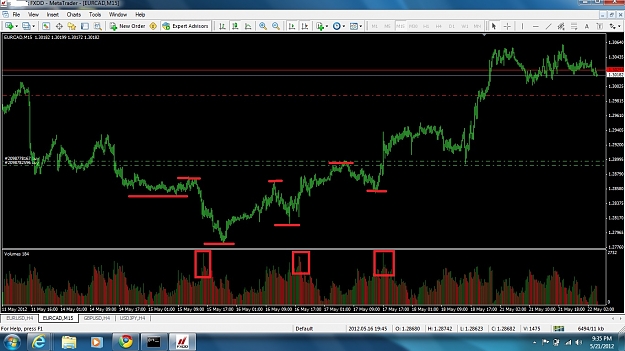
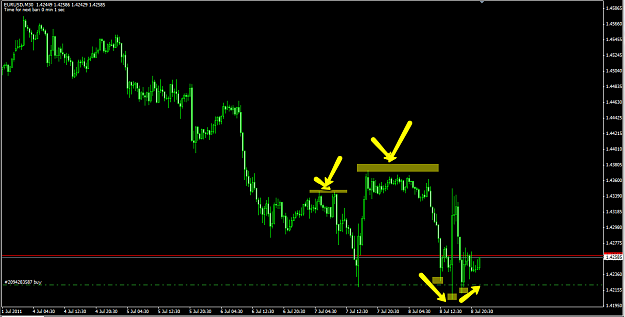
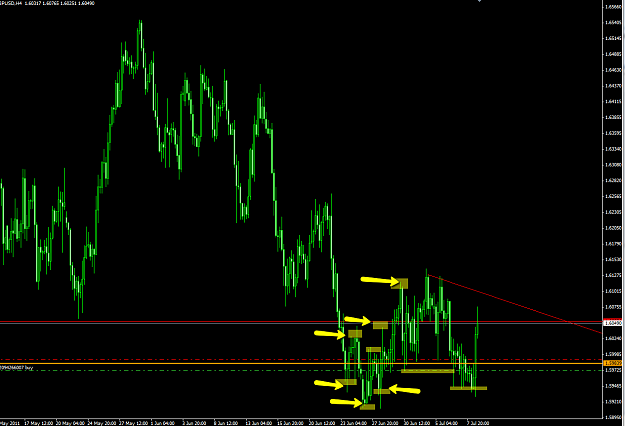
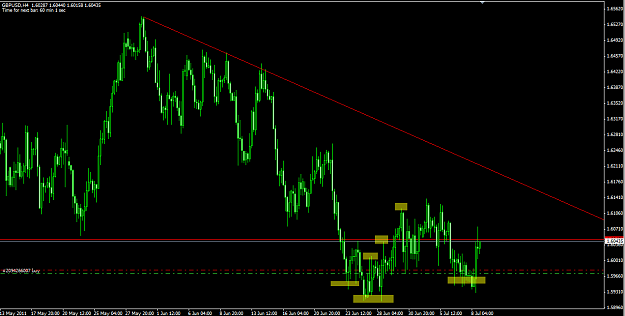
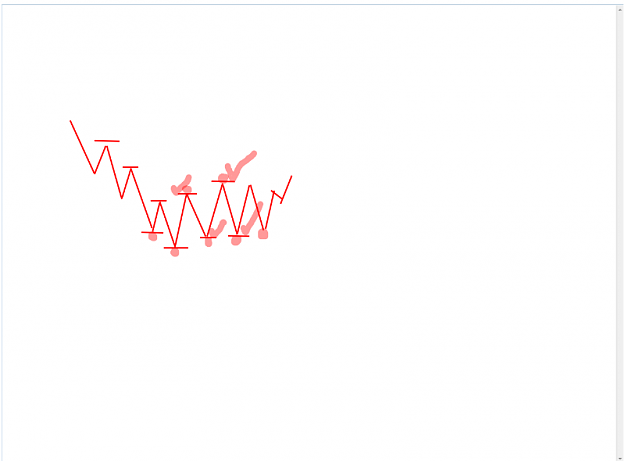
I called my buddy, said man I am jumping back into trading, I am ready to go. I said I am trading naked (priced only charts no indicators). After I threw off all my indicators and started trading again, I realized where my trading went wrong (aside for being over leveraged). I actually started to see the market for what it really is. I showed a buddy of how I have started trading and I found a ton of success with this. Not rich success but success in trading. I told him I lowered my leverage, and started trading a new smaller account and trading much smaller lots. Below is an example of a chart I showed him and I sent him many examples of these trades which I was taking:
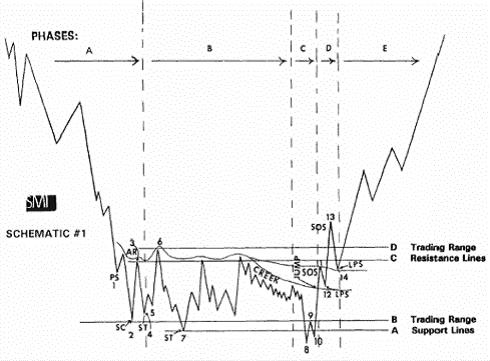
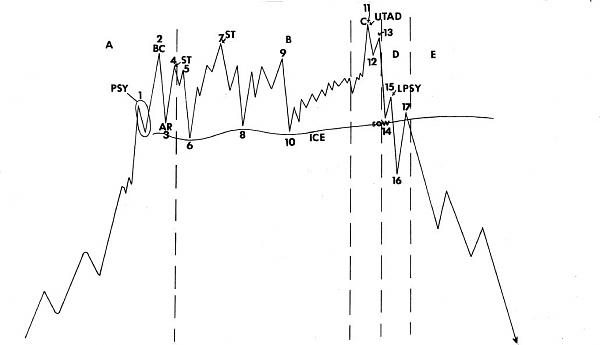
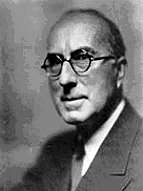
So he started seeing my entries and he said man how and what are you doing to make those trades, I said that its just the way I started seeing the market. He replied well man that looks like Wyckoff. I am asked who the heck is that? He replied its Jack Wyckoff. Look him up. So I looked him up and to my dismay I saw Jack Wyckoff Trading method charts. I will post those in the next reply to give a brief overview of who he is.
A bit about me:
My intro to trading
I started trading forex a couple of years ago, after I realized that my daytrading stocks was minimal because of insufficient funds to trade unlimited roundtrips in the stock market. I quickly joined a trading forum/chatroom. I started learning all about trading, as much as I could. Free videos, Free Webinars, and free pump n dump stocks to say the least (I didnt even touch these, I was just here to learn the different instruments used to trade markets). Once I realized I did not have the minimum day trader status funds in my account. I did a bit more research and came accross Forex.
My Intro to forex
I started seeking out more about this forex. To make a long story short it brought me to babypips (I learned everything I needed to know about trading at the time from babypips). So I found out I could trade currencies with little money thanks to leverage.
My Forex trading experience
I ended up opening my first demo account. Did great on this till I realized that I was ready to open a new account about 3 months later (big mistake this was). I tried systems, all kinds of indicators, this, that, and a little of everything only to blow my account. Too much emotion, didnt understand about levereging properrly, and impatient. I opened another account a much bigger account $2K drew it down to about $700, then i built it back up to $2001K again and was so happy I thought I finally got the big picture. I repaired my account from $700 to $2K in less than a few weeks. Boy oh Boy, I though I was Mr. Hot Shit... lol; however a couple weeks later to my dismay I was humbled... I drew my account to $500 because I was cocky, overlevereged and overtrade. A total year and a half had gone by throughtout my trading forex to acheive loser status. Upset, furious, angry, spending 1000's of hours staring at charts, looking for the holy grail I couldnt come to grip with reality and my easily disillusioned trading.
Where trading took a turning point for the better for me.
After so much frusteration, I decided to get rid of indicators, emotions, and and decided to really see the market for what it really is. I had a buddy I was trading with via skype and we would share thoughts and ideas. Both of us were fed up at this point and I told him one day... Man I am done. I need a break for about a month and gather my thoughts and focus on how I was going to study charts and see what the market was really doing. Seeing throught the smoke and mirrors. My buddy agreed and said he was going to do the same thing. We kept in contact and tried to mentor each other. (I am a self tought trader and so was he. We never paid for training except for the money which we lost)... I studied, and studied PA, on FF, on the Internet and everywhere I could think of. I was ready to jump back into trading...
This is the end my friend
I called my buddy, said man I am jumping back into trading, I am ready to go. I said I am trading naked (priced only charts no indicators). After I threw off all my indicators and started trading again, I realized where my trading went wrong (aside for being over leveraged). I actually started to see the market for what it really is. I showed a buddy of how I have started trading and I found a ton of success with this. Not rich success but success in trading. I told him I lowered my leverage, and started trading a new smaller account and trading much smaller lots. Below is an example of a chart I showed him and I sent him many examples of these trades which I was taking:
So he started seeing my entries and he said man how and what are you doing to make those trades, I said that its just the way I started seeing the market. He replied well man that looks like Wyckoff. I am asked who the heck is that? He replied its Jack Wyckoff. Look him up. So I looked him up and to my dismay I saw Jack Wyckoff Trading method charts. I will post those in the next reply to give a brief overview of who he is.
Attached Image(s) (click to enlarge)
Attached Image
Know when to hold em, Know when to fold em!