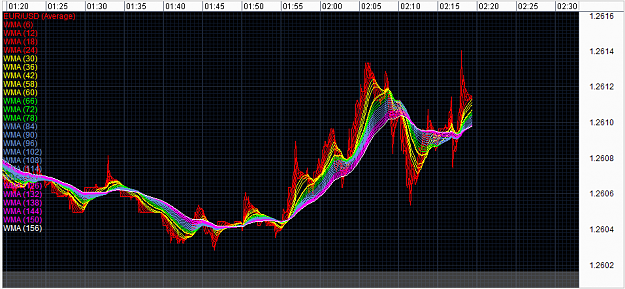
If any coder sees value in this...
I just found several old threads as I was looking for folks involved in "rainbow / cyrox / short-term scalping, and also for a specialized "grid" indicator (of sorts)...
Here is the goal: to have a *dynamic-adjusting grid* of horizontal / verticle lines that will respond to the volitility (tick?) pip activity in the market, and by user adjustable volume...like 5 or 10 etc. and this will show at the far right edge of the chart) AND over a given (adjustable) time (minutes... and even seconds?), and this will be shown at the lower edge of the chart (like each 30 seconds, minute, 5 minutes, or what you want).
And this "grid is to show true market momentum dynamically in a way that where the "boxes" or cells are square or narrow, it shows *little* activity going on; where the boxes are wider / flatter rectangles, it shows *greater* activity occuring at this (selected) time period.
This kind of "grid" will immediately (and in history) show us where the activity presents lesser, "stay out" movement, and where there is (perhaps) more action/activity going on, to inform us it is a time worthy of consideration (along with our other filters) to, for instance, enter a trade (and I am selfishly referring to very short-timeframe scalping techniques, but the usefulness goes much further).
Any chance the value of such an indicator is wort developing for MT4 / MT5? Or that (wow!) there is such a thing already available?!
Thanks for your consideration.
Ron
