• Home
  • Forums
  • Trades
  • News
  • Calendar
  • Market
  • Brokers
  • Login
  • Join
  • User/Email: Password:
  • 11:04am
Menu
  • Forums
  • Trades
  • News
  • Calendar
  • Market
  • Brokers
  • Login
  • Join
  • 11:04am
Sister Sites
  • Metals Mine
  • Energy EXCH
  • Crypto Craft

Options

Bookmark Thread

First Page First Unread Last Page Last Post

Print Thread

Similar Threads

Multi time frame Simple MACD system 822 replies

Time Frame Vs Personality, Which to choose as Main Time Frame? Who Are You? 10 replies

Multiple Time Frame Trading: In a divergence, which frame dictates? 6 replies

Time frame and Enter/Exit, Time frame and S/L, T/P relationships. 91 replies

Question on Lower Time Frame Indicators Vs. Longer Time Frame 7 replies

  • Trading Systems
  • /
  • Reply to Thread
  • Subscribe

Another simple system - Time-Frame 15

  • Last Post
  •  
  • 1 143144Page 145146147 1505
  • 1 Page 145 1505
  •  
  • Post #2,881
  • Quote
  • Edited at 1:44pm Jun 9, 2012 11:35am | Edited at 1:44pm
  •  Gibril
  • | Additional Username | Joined May 2012 | 1,021 Posts
Quoting traderpalu
Disliked
hello.. please help
i already set the TDI, but there are no yellow line in my TDI

please help me, how to set the yellow line in TDI ?

thx
Ignored
Post # 24, answer given Post # 25
Quoting Snowdogg
Disliked
Hi: Looks like a system I could work with. I installed the indicators you posted. There is no Yellow Line on my TDI chart. How can I get one there? Thamks
Ignored

Post # 93. answer given Post # 96
Quoting sutters
Disliked
Just been reading the thread looks like a great system loveevery1 will start to follow it very closely.
Im not sure if someone has asked already I have read the whole thread and couldnt find it.
My TDI indie hasnt got the yellow line on it I have had a muck around with it with no luck can anyone help please.
Cheers
Ignored
Post #103, answer given Post #104
Quoting Trader41
Disliked
Hello,

I have instal the indicators and temple.
TDI i have no yellow line.
What is wrong?

Regards Trader41
Ignored

Post # 110, answer given in Post #112,
Quoting Baiazid
Disliked
Hi loveevery1.


I have one issue:
I downloaded yesterday TDI indicator (the one posted here) and I don't have the 3rd line (yellow one).
Ignored

and many more until Big Brother wrote this

Quoting loveevery1
Disliked
i even get PMs for the same thing..with the yellow line....
Ignored

I see a lot of responses proving that you didn’t read the entire thread before posting.
Maybe...... Try a bit harder and start with post #1, then you will see how this thread grow. That's where I started to learn about this system.

Gibril The Newbie
  • Post #2,882
  • Quote
  • Jun 9, 2012 11:39am Jun 9, 2012 11:39am
  •  Intrepidpips
  • Joined Aug 2011 | Status: Mos P from Cape to Cairo | 2,444 Posts
[quote=Olarion1975;5742109]Hi Herny,

your chart shows a normal pivot indicator...I have tons of them...

The one I like best (and currently use myself) is attached.[/quote

Thanks Olarion I'll give it atry
Let it turn and find your entry.
  • Post #2,883
  • Quote
  • Edited at 4:13pm Jun 9, 2012 3:39pm | Edited at 4:13pm
  •  Gibril
  • | Additional Username | Joined May 2012 | 1,021 Posts
Hi Everyone,

this is newbie question and all experienced traders are willing to help me with this
How to identify a whether a trending or range trading of a day, which time frame chart would be more appropriate for a day trader?

I've read in some posting, the following ways of deteriming factors , but I just couldn't understand it and how does one measure the following to get to the above answer ?
Please help, maybe due to the fact i'm still new to forex.

The factors are:

SPEED: ?

- Measure the speed of the market using Medium-Term Moving Averages.
- Measure the speed of the market with the Angle & Separation of at least two Medium-Term Moving Averages.
- The greater the Angle & Separation, the greater the speed.

MOMENTUM: ?

- Measure the momentum of the market using Short-Term Moving Averages.
- Measure the momentum of the market with the Angle & Separation of at least two Short-Term Moving Averages.
- The greater the Angle & Separation, the greater the speed.


Thank You for your help

Gibril The Newbie
  • Post #2,884
  • Quote
  • Jun 9, 2012 4:59pm Jun 9, 2012 4:59pm
  •  farhanzaveri
  • | Joined Jun 2012 | Status: Member | 20 Posts
HI Lovevery1,

First, thank you for posting you stystem, it is great!

I am still grasping the entry and exit rules for the system

For a sell entry:

The 10 MA must be below the 200 MA.
The Green TDI must cross the red TDI below the Yellow TDI. ( in waht direction)

Can you confirm the above? If so, in posts #362, and #366 the entry rule wasnt followed? The Green TDI crossed yellow first, and then crossed the red TDI above the eyellow?

If anyone can explain why and the exact trading rules i would greatly appreciate it! thanks!
  • Post #2,885
  • Quote
  • Edited at 1:02am Jun 10, 2012 12:43am | Edited at 1:02am
  •  Gibril
  • | Additional Username | Joined May 2012 | 1,021 Posts
Quoting farhanzaveri
Disliked
HI Lovevery1,

First, thank you for posting you stystem, it is great!

I am still grasping the entry and exit rules for the system

For a sell entry:

The 10 MA must be below the 200 MA.
The Green TDI must cross the red TDI below the Yellow TDI. ( in waht direction)

Can you confirm the above? If so, in posts #362, and #366 the entry rule wasnt followed? The Green TDI crossed yellow first, and then crossed the red TDI above the eyellow?

If anyone can explain why and the exact trading rules i would greatly appreciate it! thanks!
Ignored

Brother farhanzaveri,

As this thread developed, the owner had introduced several more set-up to optimized as well catch the good set-up. There is at least five set-up in this system.
1. Basic set-up – for beginner and Newbie (me included)
2. Bounce Trade
3. 240 mins or 4Hrs TF set-up
4. Counter Trend Set-up (CT)
5. Strategy based on 200EMA.

The owner of this thread are so kind enough to let us learn more advance technique for better result ( Based on the same indicator, but with different set-up)
Back to your question. I will try to answer you concern in the best possible ways ( Newbie view, maybe some experienced traders or the Chief of the house will correct this answer if it's wrong).

Q1 For a sell entry:
The Green TDI must cross the red TDI below the Yellow TDI. ( in waht direction)


Traders Dynamic Index (TDI) - the green have to cross the red the yellow line ( TDI ) to be confirmed as part of the signal

Long entry = RSI PL > , TSL, and >MBL , but < 68.
Short entry = RSI PL < , TSL, and<MBL , but > 32.
For the one that we are discussing now, we need the cross of the yellow line. In particular the green should cross the yellow line and the slope of the yellow should point little upwards (for long) and downward (for short)
According to the TDI we don’t take short trades near the 32 level and we don’t go long at the 68 level.
(Go through Dean Malone's pdf file for further details)


Q2 Can you confirm the above?
YES, based on Basic Set-up for beginner

Q3 If so, in posts #362, and #366 the entry rule wasnt followed?


I repost the chart in this reply. The following is my observation on the trade taken ( as I understand it- someone will correct it later)


POST #362, 29th Mar, 2012
“Take a look at this chart after US open...dont knw why this system works...LV1" ( this is what he said with the chart attached)

This is my view: ( Newbie)
EUR/USD Pair. The entry was for New York opened ( After the second vertical line). White shaded highlighted area is the LONG trade he took. This is basic set up and the best book entry.
The Red vertical line, is London open. Nothing being highlighted there.


POST #366, 21st Mar, 2012

+17 pips on AU.... ( this is what he said with the chart attached)

This is my view: ( Newbie)
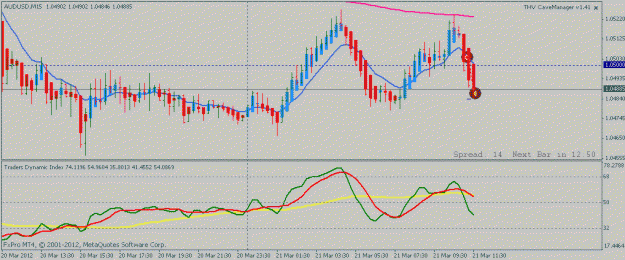
AUDUSD Pair. The entry was after London opened. SHORT trade he took is basically a text book entry for Beginner Set-up. . This is basic set up and test book entry. The Price was below 200EMA, Green cross Red, then cross Yellow. Then we have Price broke down at Round Number (RN), Price is already closed below10EMA, and HA Candles has already turned RED ( two candles).
With at least SIX sign for going SHORT, thus initiating short trade at the second RED candles is a very low risk entry and proof profitable.

Q4 If anyone can explain why and , done.


Q5 the exact trading rules i would greatly appreciate it! thanks!

The Basic Rules is as post #1. Other rules are all over. I'm compiling it now need to to cover all five Strategies with different set-up and perimeter. Once complete, the owner discretion to disrtibute.


This is the best answer I can give. But other senior traders in this thread may wish to correct me, if my view is unacceptable, as I'm still learning this system for the 3rd Months.

Thank You and welcome to this thread.

Gibril The Newbie

P/s Take you time look around, if you need anything, post questions. Many experienced traders here are helpful and are more willing to answer your concern.
Attached Image (click to enlarge)
Click to Enlarge

Name: Au Post # 366.gif
Size: 15 KB
Attached Image
  • Post #2,886
  • Quote
  • Edited at 9:43pm Jun 10, 2012 1:42am | Edited at 9:43pm
  •  Gibril
  • | Additional Username | Joined May 2012 | 1,021 Posts
Reference to previous posting, I may have made an error regarding the set-up. This is what is I think the missing Set-up, or it may be part of the other set-up. We wait for the Boss to comment.

There maybe more than five set-up. I've mentioned earlier. As I'm orginising for full documentation, the Owner of this Thread did mention another set-up.
since everyone is happy with the existing set-up, the owner did not follow thro the idea for now.

I call this,
# 6) "Cross Trade" Set-up : ( this this the outline of Cross Trade )


Till then stick around, if we're lucky enough , LV1 will teach us, if not be thankful for what we have now, Five System , with same Chart to work with. That's handful.


Thank You for reading my post


Gibril The Newbie

  • Post #2,887
  • Quote
  • Jun 10, 2012 3:16am Jun 10, 2012 3:16am
  •  xiaoxin
  • | Joined Sep 2010 | Status: Member | 397 Posts
Hi, folks, I do some homework on GU.
I like to do sth before trading,especially on Sunday.
In my view, it's very important to get prepared on Sunday.

Hope you can spare a few minutes reading my post.
Any comments is welcome.

Thanks for Ur help.

I look at the Weelky chart first.
Attached Image (click to enlarge)
Click to Enlarge

Name: GUW1.jpg
Size: 48 KB

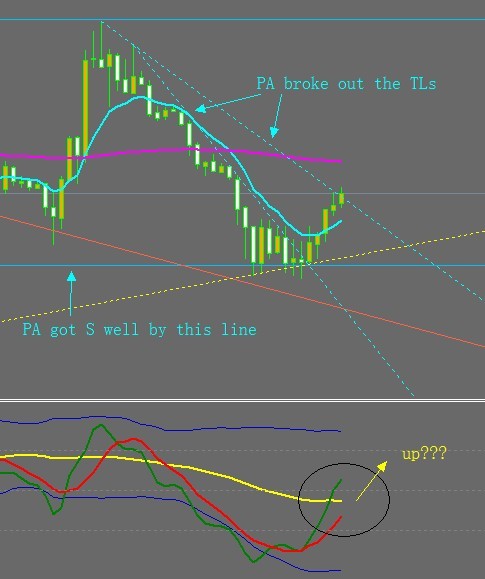
Look at the TL on the top, 1st and 2nd touch of EMA200 made a down TL, and this TL works well as a R when there was a 3rd touch.

Attached Image (click to enlarge)
Click to Enlarge

Name: GUW2.jpg
Size: 83 KB

Look at the candlestick patterns above:
1. Bearish engulfing
2. Bearish harami
3. Bearish engulfing
sreaming SELL SELL PLS!


4.5.Bullish engulfing
6.Bullish harami followed by a hammer or a hammer
7.Bullish engulfing
8.Bullish harami
  • Post #2,888
  • Quote
  • Jun 10, 2012 3:24am Jun 10, 2012 3:24am
  •  xiaoxin
  • | Joined Sep 2010 | Status: Member | 397 Posts
Let's go from HTF to LTH
Daily--H4--H1-M15
Daily chart
Attached Image (click to enlarge)
Click to Enlarge

Name: GUDaily.jpg
Size: 82 KB

H4
Attached Image (click to enlarge)
Click to Enlarge

Name: GU H4.jpg
Size: 90 KB

H1
Attached Image

M15
Attached Image (click to enlarge)
Click to Enlarge

Name: GUM15.jpg
Size: 65 KB


Not so sure of the analysis here.
Correct me please if there is any mistake.

Thanks for Ur help!
  • Post #2,889
  • Quote
  • Jun 10, 2012 5:08am Jun 10, 2012 5:08am
  •  Forex37
  • | Joined Oct 2006 | Status: Member | 527 Posts
First thanks to the thread starter for teaching his system - which was traded profitably by him before.

During the course of this thread the system (like on most other threads) has been changed and evolved.

Could some kind sole make a nice pdf??

Thanks
  • Post #2,890
  • Quote
  • Jun 10, 2012 6:07am Jun 10, 2012 6:07am
  •  channelman
  • | Joined Jun 2012 | Status: Member | 9 Posts
Quoting xiaoxin
Disliked
Let's go from HTF to LTH
Daily--H4--H1-M15
Daily chart
Attachment 979741
H4
Attachment 979742
H1
Attachment 979746
M15
Attachment 979747

Not so sure of the analysis here.
Correct me please if there is any mistake.

Thanks for Ur help!
Ignored
Hi xiaoxin.. I'm a newbie to this room and still learning. I think your analysing of the market using the higher TF's with candle patterns/s&r levels and TL's and then moving down to the LTF's to look for potential entry is logical and well presented.. Just what LV1 teachers us to do.. Thanks for sharing .
  • Post #2,891
  • Quote
  • Edited at 12:41am Jun 11, 2012 12:22am | Edited at 12:41am
  •  Gibril
  • | Additional Username | Joined May 2012 | 1,021 Posts
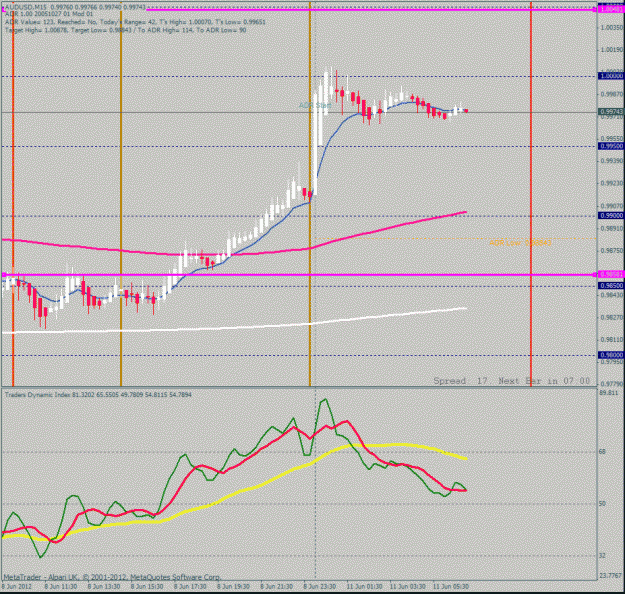
AUD USD. looking at these two charts, i see price is moving towards1.00481- 1.00100 area. the 1.0000 tested again today. The last test of this level was on 7th June. And today we can see , PA is higher than 7th Jun candle,

As for short term outlook,, PA for the past 7 hourly candles, has not able to close higher than the opening candle for today ( after the gap)

Maybe a fake move to the downside. ?, as price may rebound from 10EMA at LO.

Note : PA on 60 mins is sitting right on top of 800EMA.

My verdict : Price goes up to 1.00481 +++level at LO, then before NYO, it will back down and consolidate at the open PA level ( testing this level again), After LO closed PA may continue down.

(don't laugh at this stupid analysis ok.i'm Newbie trying to learn.)

So i'll welcome corrections and ideas on my newbie analysis, so i can learn.


Thank You for reading me post.

Gibril The Newbie
Attached Images (click to enlarge)
Click to Enlarge

Name: au 15mins.gif
Size: 31 KB Click to Enlarge

Name: au 60 mins.gif
Size: 32 KB
  • Post #2,892
  • Quote
  • Edited at 12:50am Jun 11, 2012 12:49am | Edited at 12:50am
  •  Gibril
  • | Additional Username | Joined May 2012 | 1,021 Posts
Hi again,

sorry to ask so many question in this thread. I hope experienced traders can help me with this.

This is again a newbie question.

I've been doing this calculation manually every week for the past 2 months. I couldn't find searching all thread and www. . If any of traders here have this indicator that would like to share ?

Doing it manually, i found it was off by 30-42 pips on weekly basis.

This makes my life a bit easier every week then. Thank You for you help.

Gibril The Newbie
Attached Image
  • Post #2,893
  • Quote
  • Edited at 1:33am Jun 11, 2012 12:55am | Edited at 1:33am
  •  Gibril
  • | Additional Username | Joined May 2012 | 1,021 Posts
Quoting xiaoxin
Disliked
Let's go from HTF to LTH
Daily--H4--H1-M15
Daily chart
Attachment 979741
H4
Attachment 979742
H1
Attachment 979746
M15
Attachment 979747

Not so sure of the analysis here.
Correct me please if there is any mistake.

Thanks for Ur help!
Ignored

VERY Nice, xiaoxin

You're very sharp with your analysis. I wish, could learn how to do that precision works. I will always look forward experienced traders input, such as this to learn improving my trading skill.

Thank You xiaoxin, will keep watching your post and look forward for update.

Gibril The Newbie
  • Post #2,894
  • Quote
  • Jun 11, 2012 1:00am Jun 11, 2012 1:00am
  •  loveevery1
  • Joined Feb 2012 | Status: Member | 3,108 Posts
EU?

weekly chart lets see this week
Attached Image (click to enlarge)
Click to Enlarge

Name: 1.png
Size: 20 KB
Let all the living things live blissfully
  • Post #2,895
  • Quote
  • Edited at 2:07am Jun 11, 2012 1:40am | Edited at 2:07am
  •  Gibril
  • | Additional Username | Joined May 2012 | 1,021 Posts
Hi everyone.

I'm thinking and trying to understand PA by using 240mins EU Chart.

As long as PA doesn't touch the top RED lines to test it, it will not be ready to go down. Just to clear things up, will this trend runs out of steam when the price has reached the closed many take profit positions,therefore reducing the buyers,and letting the sellers take over? (circle area).

Only by confirming this touch, I will relook at the reaction of PA at that level ( and 15M TF), before commiting for a trade. It may want to go for the next level ( pink line) nearing the 200EMA = 50EMA (4hrs ).

Till then, i wait for other experience traders to show me a lesson or two on this current set-up.

Thank You


Gibril The Newbie
Attached Image (click to enlarge)
Click to Enlarge

Name: eu 240 mins.gif
Size: 221 KB
  • Post #2,896
  • Quote
  • Jun 11, 2012 3:10am Jun 11, 2012 3:10am
  •  By_Tor2114
  • Joined Feb 2012 | Status: The 2% club. | 576 Posts
Here is the 4 Hour view of the E/U. We can see the gap has been fairly large and price is bouncing off previous resistance. Looking at the 15M chart, we can see it has rejected at that resistance all through the Asian session.

Here's hoping for more moves up
Attached Images (click to enlarge)
Click to Enlarge

Name: eu 4h.gif
Size: 49 KB Click to Enlarge

Name: eu 15m.gif
Size: 44 KB
In boxing, all the champion's results are visible. In forex, talk is cheap.
  • Post #2,897
  • Quote
  • Jun 11, 2012 3:43am Jun 11, 2012 3:43am
  •  By_Tor2114
  • Joined Feb 2012 | Status: The 2% club. | 576 Posts
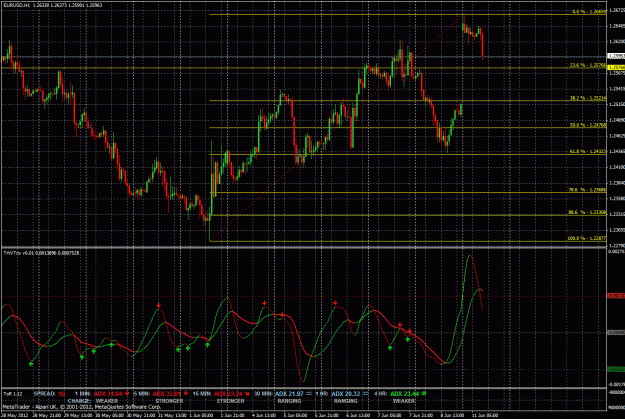
Ok, so the opportunity for a long at that level did not come. The next level on this chart is at the 236 line, priced at 1.2576. Let's see if anything comes up there.
Attached Image (click to enlarge)
Click to Enlarge

Name: eu 1h.gif
Size: 58 KB
In boxing, all the champion's results are visible. In forex, talk is cheap.
  • Post #2,898
  • Quote
  • Jun 11, 2012 4:43am Jun 11, 2012 4:43am
  •  ckikadikoi
  • | Joined Apr 2012 | Status: Member | 143 Posts
wait for a break out of this ...

Attached Image (click to enlarge)
Click to Enlarge

Name: AUDUSDM15.png
Size: 24 KB
  • Post #2,899
  • Quote
  • Jun 11, 2012 5:01am Jun 11, 2012 5:01am
  •  willy2012
  • | Joined Jun 2012 | Status: Junior Member | 2 Posts
thank you for this simple system iwill try it...
  • Post #2,900
  • Quote
  • Jun 11, 2012 5:03am Jun 11, 2012 5:03am
  •  willy2012
  • | Joined Jun 2012 | Status: Junior Member | 2 Posts
do you think it is working good for 5 minute time frame with eur/usd or gbp/usd.
  • Trading Systems
  • /
  • Another simple system - Time-Frame 15
  • Reply to Thread
    • 1 143144Page 145146147 1505
    • 1 Page 145 1505
0 traders viewing now
  • More
Top of Page
  • Facebook
  • Twitter
About FF
  • Mission
  • Products
  • User Guide
  • Media Kit
  • Blog
  • Contact
FF Products
  • Forums
  • Trades
  • Calendar
  • News
  • Market
  • Brokers
  • Trade Explorer
FF Website
  • Homepage
  • Search
  • Members
  • Report a Bug
Follow FF
  • Facebook
  • Twitter

FF Sister Sites:

  • Metals Mine
  • Energy EXCH
  • Crypto Craft

Forex Factory® is a brand of Fair Economy, Inc.

Terms of Service / ©2021