~~~~~~~~~~
Why am I starting this thread?
I don't know, to tell you the truth.
... partly ego, partly loneliness I think.
However...
I do know that trading is a very lonely experience.
~~~~~~~~~~
My trading strategy is based on about 10 years experience trading Forex. If a system, method or EA is out there I've bought or tried it.
I learned to trade on 5 minute charts and morphed myself into a trader who checks my daily charts each morning as the daily candle finishes (I'm Australian based).
If I see a possible setup based on simple Price Action (pin, inside, engulfing bars near support/resistance (horizontal, dynamic, pivots or fibs) I'll move to 4 hour or 1 hour charts for confirmation and entry setups. I may even move to a 15 min chart in some circumstances.
I mainly trade with the daily/weekly trend, but I will trade counter trend if conditions tell me to do so. I hate to admit it, but I've learned through bitter experince that trying to second guess the market only leads to heartburn and loss of precious funds. I've blown out 4 or 5 live accounts in 10 years, and one of those was a 6 figure account (mine too).
I've learned that to make money in this game you need a lot of it to start with, or have friends with a lot for you to trade (for you to learn on).
I've named the journal $2,000 to $2,000,000 however that is just an ego driven thought. I was taught long ago to set goals, and make those goals high, so...
At 5% increase per month it will only take about 12 years... and 5% a month is conservative of course, but it's realistic.
Edit... my father was a gambler, and I am too. He taught me how to work out my returns on betting on horses at certain odds, at the age of 6 or 7 from memory. I was betting on horses from about 12 years old. I only stopped when I discovered Forex.
Because of his teaching, I'll probably be greedy, and do it in a lot less than 12 years, or go bust trying.
I have established a small LIVE account to place my trades on and keep myself honest. This account was started May 16th 2012 with $2,000 starting capital.
I honestly believe my strategy can take my account from $2,000 to $2,000,000 in less than 12 months... 80% increase per month will do it, which is an average of just under 3% a day. UPDATE 6 months later... sheesh, and I was so full of hope.
Big claim (for sure), but let's see how the cards fall, hey!
Some of my swing trade strategies follow with examples as they happened in the following 4 or 5 pages...
I've not posted any specific day trading or scalping strategies although the swing strategies are often day trades if price moves fast.
5 months later... I started out quite well, but deteriorated when the good trend stopped, and when I didn't pick the reverse in trend, I lost big. Then started chasing losses and lost even more. Reduced the balance to under $750.
I then took a few months off and trained myself to place a StopLoss on EVERY trade, and at a maximum of 20 pips. My aim is to get that Stop to BreakEven +1 if I can, and if not, to minimize my loss to less than 20 pips.
My entry's have changed, I'm picking reversals and if I get to BreakEven +1, letting the trades run.
Risk is 2% of the account balance per trade. No set target per day, however a 20 pip win is obviously about a 2% win (depending on the currency pair). I'm focussing on the eur/usd, aud/usd and gbp/usd.
I restarted trading, with this strategy Oct 17th 2012 ...
http://www.forexfactory.com/showthre...27#post6106627
UPDATE... 5th Dec 2012...
My broker moved my account to a different server, so my Trade Explorer had to be reset, and I took the opportunity to add $1,300 to bring the new balance up to $2,008 which is the restart balance as of 6 Dec 2012
UPDATE... 19th July 2013...
Changed my strategy 23rd June 2013 taking trades based on the average daily range... (ADR or ATR), I adjust trade size according to account balance, set stops and take profits on entry of each trade.
After 4 weeks 71 trades closed with 67 winners (94.4%)... account balance increase of 32.8% and 3088 pips. Max drawdown 1.8%
Another update 2nd May 2022...
I began a small live account again... $292.00 this time. The Trade Explorer is here... IB MAXIMIZER
I started a Trading Discussion thread on my trading method called Inside Bar Maximizer
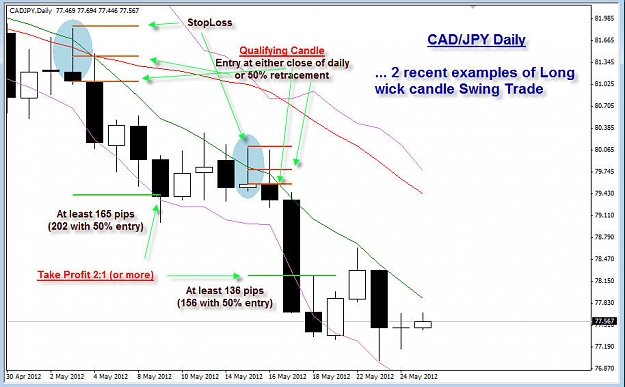
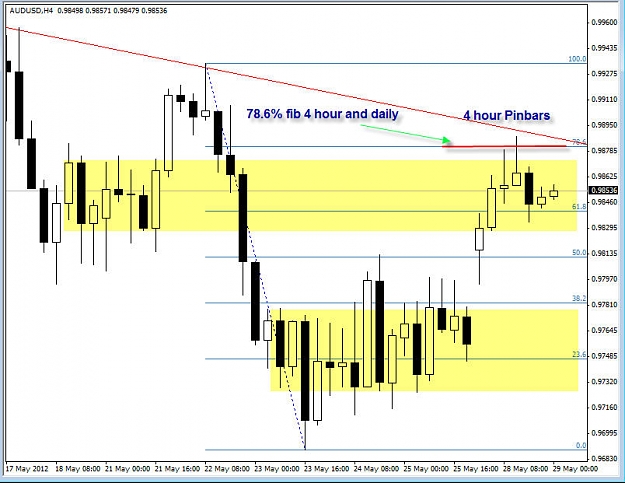
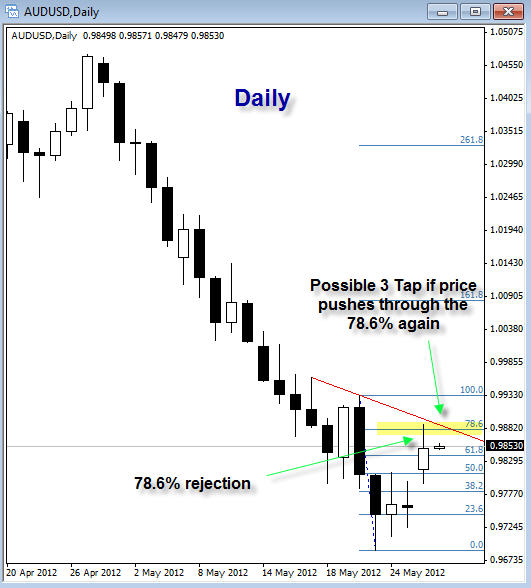
Swing trades using a long wicked candle
- Daily Charts with 8 & 16 EMA's
- ONLY trade with the Trend... no trend, no trade!
- Wait for a Hammer, Shooting Star, Hanging Man, long wick Doji, pinbar... (call it what you will, it's any candle with a long wick... the long wick must be at least ⅔ of the total candle length). Wait for this Daily candle to close.
- The long wick must at least touch or piece the 8 EMA... this is the "qualifying candle"... if it doesn't touch at least, it won't be a AA+ trade.
- Enter at the next days Open.
- Place a Stop 2 to 5 pips below or above the long wick of the qualifying candle.
- Take Profit must be at least 2:1 of the number of pips of the Stop... if the stop is 150 pips from the entry, then you place a Take Profit of at least 300 pips (assuming there's no support/resistance telling you otherwise).
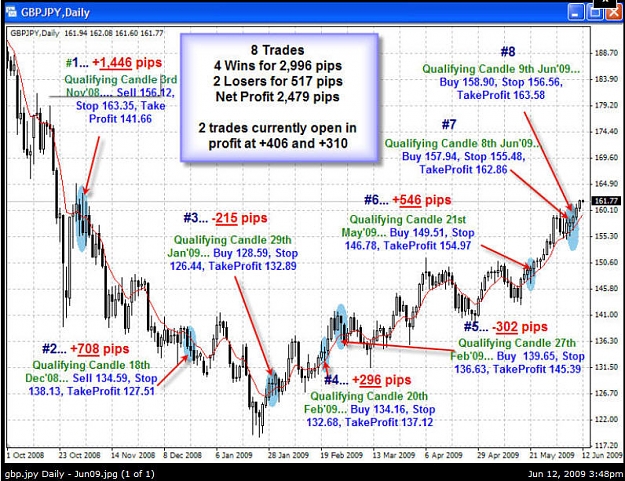
That's the basic rules. You'll get a trade about every 4 weeks on most pairs (on daily charts). Occassionally you may get several trades a week. If you watch a dozen pairs you will get more than enough trades to keep you very busy.
This method works well on the 4 hour chart as well, but be careful if trying it on shorter timeframes...
EXAMPLES... post #30 and #65
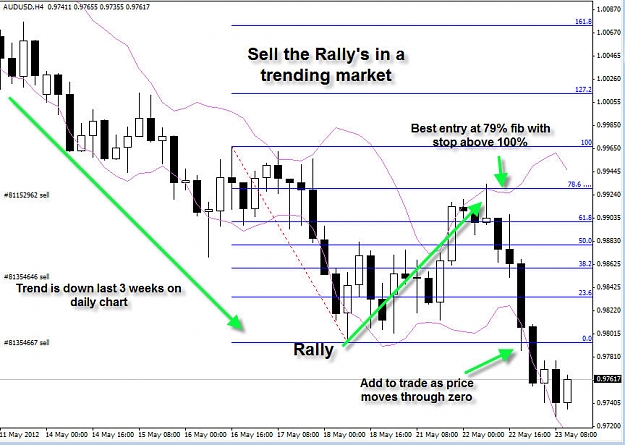
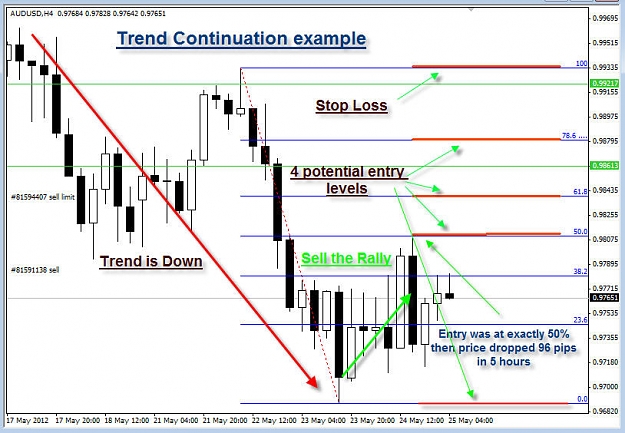
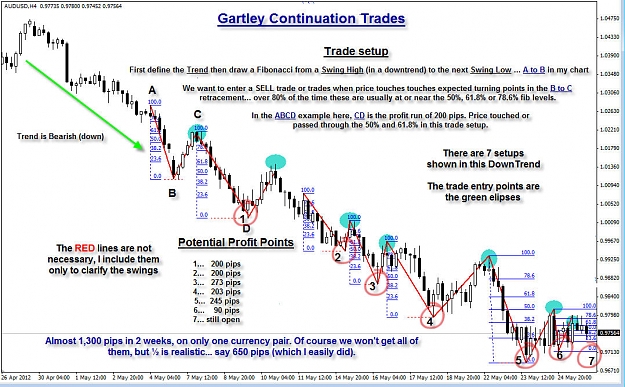
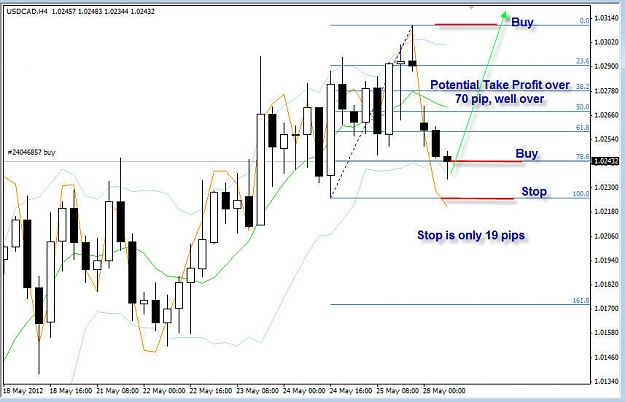
Trend Continuation Trade
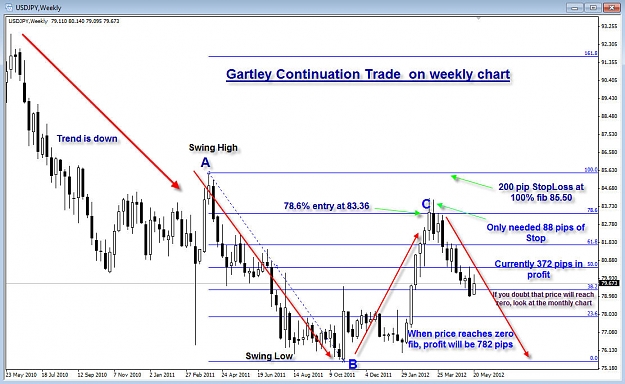
This trade is based on the Gartley trade. The idea is to sell the rallys and buy the dips in a trending market.
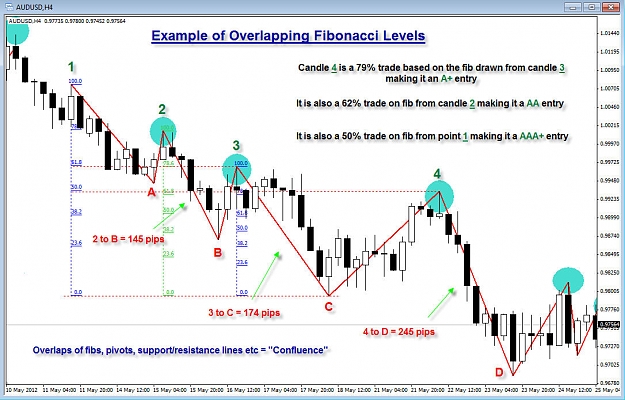
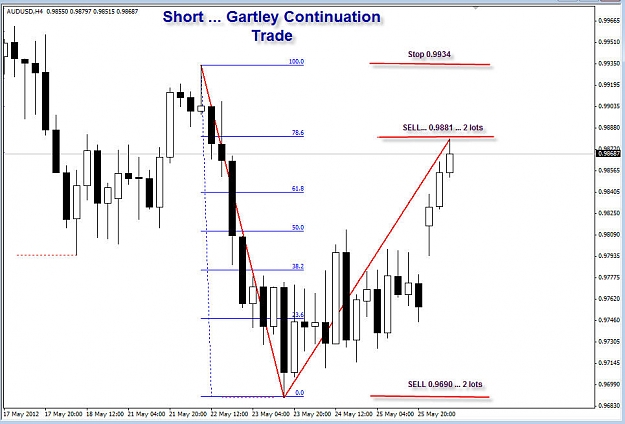
In a strong trend wait for price to plateau or consolidate, then draw a fib WITH the trend from the last obvious swing high/low point to the last low/high point. As price retreats back against the trend place small trades at the 61.8% and 78.6% fib levels with stops above/below the last Swing High or Swing Low that you used as start point to draw the fib levels.
You can use the 50% if you want a lot more trades.
As price moves in your favour place a third trade at the zero fib level and move your stops to break even on the 1st 2 or 3 trades (or you could take partial profit on one or both)
So it's possible you could get 3 trades in place if price goes to the 79% fib before it turns back strongly to your zero line (where you place the last entry's. Because of this it's important to not overleverage yourself. Allow for the possibility that you could have 3 trades in place before you move to break even.
Your ultimate take profit is based on your comfort levels, support/resistance, pivots etc... or the fib extensions.
This method works well on pretty well any timeframe, so it can be used by day traders, though I wouldn't try it on charts under 15 minute myself.
It is almost infallible in a trending market if you set stops wide enough to let your trades breathe, and don't close out profitable trades too soon.
In the 1st 14 days I placed 28 trades on various timeframes (mostely 4hr), and 27 are winners with an average of 39 pips per trade. If I'd been monitoring these trades while I was asleep there could easily be an average of more that 100 pips per trade.
EDIT... I have mucked up my live account by taking trades outside my preferred methods (my stoopid stubborn ego did it!)