DislikedThanks to all great contributors, I am learning a lot !
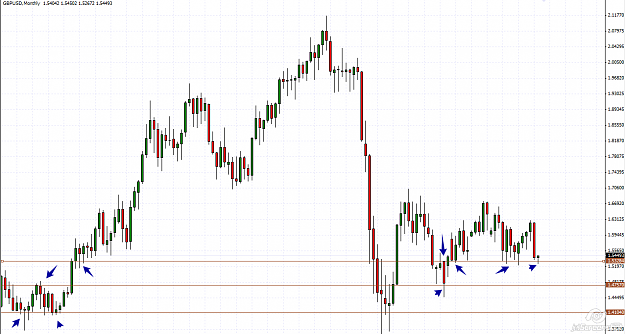
Potential trade forming on gbpnzd ?
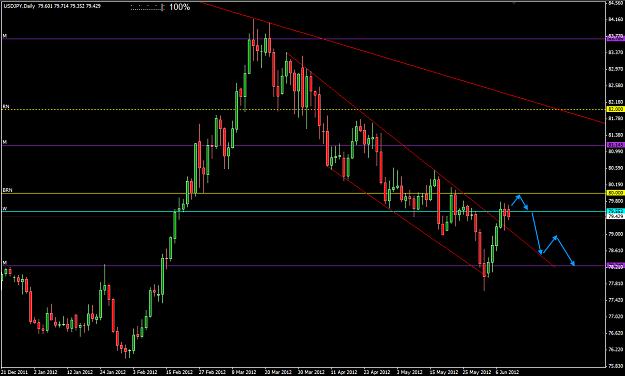
WPD :
- big DB pattern (W pattern) formed at BRN (2.00)
- P is at resistance formed by neckline of W pattern and M level, after strong bullish action
- P is breaking out of M RM, (M candle not finished yet )
WPG :
- wait for close of M candle
- wait for P to pullback to top of M RM (or lower ?)
- wait for P to resume trend up with price action on daily (or weekly ?) towards potential target of the W pattern.
This is tentative approach, I don't...Ignored
Some suggestions:
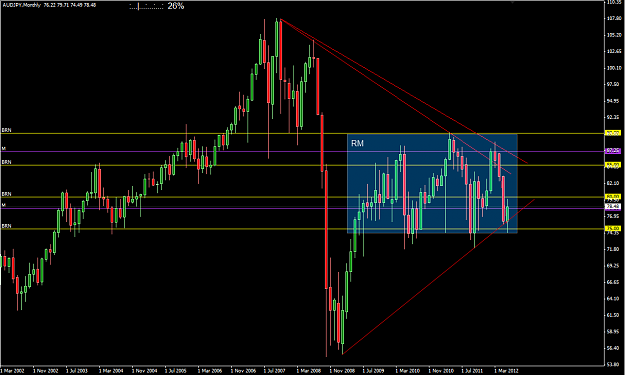
- The WPD process should be made on the M chart, then on the W chart. If concording, WPG should be made on the D chart.
- "P is breaking out of M RM, (M candle not finished yet )" is not entirely correct. As of now, price is still at the liquidity level of the Nov 2011 bar. Technically the bar pushed above the RM but if you would want to trade at the M level, it'd not be safe. The Nov 2011 bar has to be broken before the sellers sitting at that level may be safely declared as defeated.
Until then and then a subsequent RET on the RM former resistance, the double bottom is unsafe to trade.
- About your drawn DB target: DBs and general RM targets are not as reliable as triangles / head and shoulders so beware expecting a reliable prediction.
Moreover, for static RMs (including DBs), the target is calculated with the RM height. Therefore the green diagonal segment is misplaced. It has to go from the RM support to RM resistance (the red-ish rectangle you drawn) and then be projected directly above the RM itself.
That is, you calculate it on the effective levels.
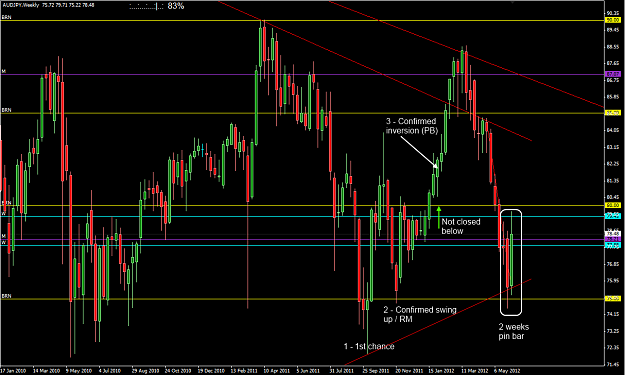
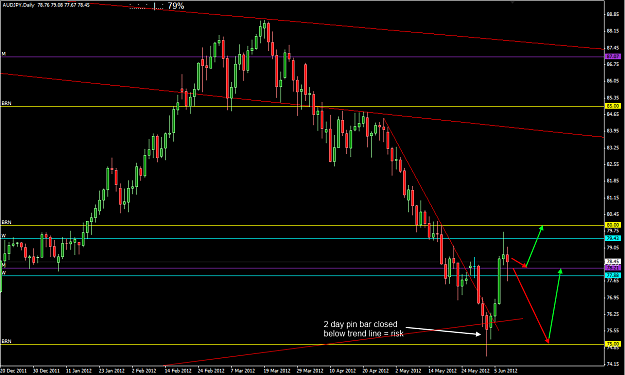
- About WPG: you will probably never be able to trade monthly bars. WPG is used to find entries on the D chart and has to be performed on the D chart. Rarely on the W.
If you open the D chart you will see how what you typed for WPG won't apply. On D you will find a different situation.