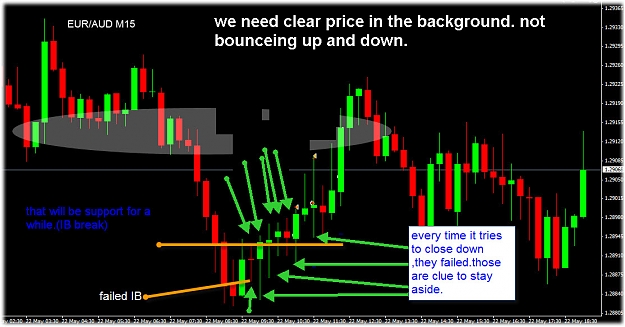
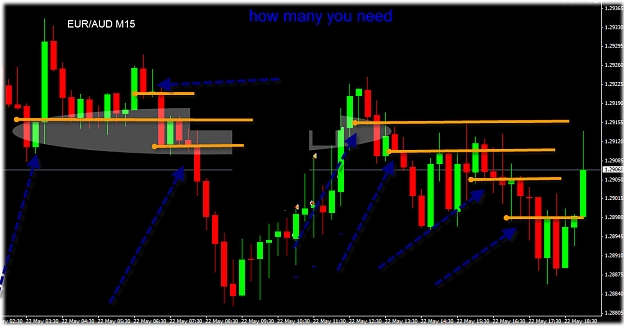
Look for reasons not to take a trade.
 Intraday price action trend trading
- #9,962
- May 23, 2012 2:17am May 23, 2012 2:17am
- Joined Mar 2011 | Status: Bullish Behavior | 3,182 Posts
- #9,965
- May 23, 2012 3:03am May 23, 2012 3:03am
- Joined Mar 2011 | Status: Bullish Behavior | 3,182 Posts
- #9,966
- Edited 4:01am May 23, 2012 3:09am | Edited 4:01am
- Joined Mar 2011 | Status: Bullish Behavior | 3,182 Posts
- #9,967
- Edited 4:07am May 23, 2012 3:52am | Edited 4:07am
- Joined Mar 2011 | Status: Bullish Behavior | 3,182 Posts

- #9,971
- May 23, 2012 5:56am May 23, 2012 5:56am
- Joined Mar 2011 | Status: Bullish Behavior | 3,182 Posts
- #9,973
- Edited 8:14am May 23, 2012 8:01am | Edited 8:14am
- Joined Mar 2011 | Status: Bullish Behavior | 3,182 Posts

- #9,980
- Edited 3:30am May 28, 2012 2:30am | Edited 3:30am
- Joined Mar 2011 | Status: Bullish Behavior | 3,182 Posts