Hello Pipalicious,
Great thread you opened! I would like to post my point of view:
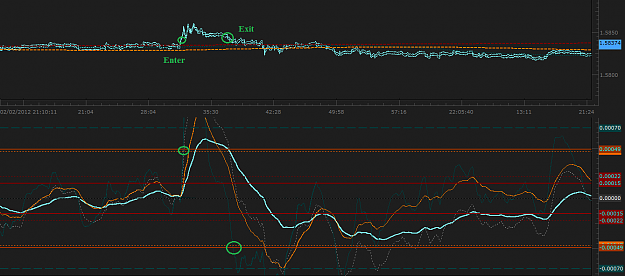
It looks like you got there the 50 EMA applied to the High to the low and a weighted 50MA applied to the median price. If so, you can see that price crosses your combo for the first time, pull back and continue for a while.....both long or short. This observation of price behavior led me to the conclusion that price looks for its balance.
Now to your original question:
Before taking any of the both formations as trade trigger I would look for what stage price is in...at the beginning of a cycle? or is it at the end of one? pushing away from its balance or coming back at it?
Many traders are under the mistaken belief that M1 charts are easier to trade and less hazardous to the trading welfare.
I have very rarely seen a trader say, phew I better look at higher time trading because this short term stuff is blowing up my account.
Almost always the other way around. Shorter and shorter timeframes and more indicators and more analysis, yeah that is what I need to do.
Then they point to some friend they have that does that or some internet sensation (the German who scalps for millions a year) which is like saying I am going to a shoot a basketball at the local gym and turn into the next Michael Jordan.
So in my mind the question of whether or not A or B is a winner is moot because using a M1 char, given enough trades over time, it is not a question of if but when that the numbers work against you - the more trades made, the more decisions to be made, the more likely things can go wrong.
I dont understand what timeframes have to do with this (by the way, its m1).
Ignored
Howdy Pipalicious,
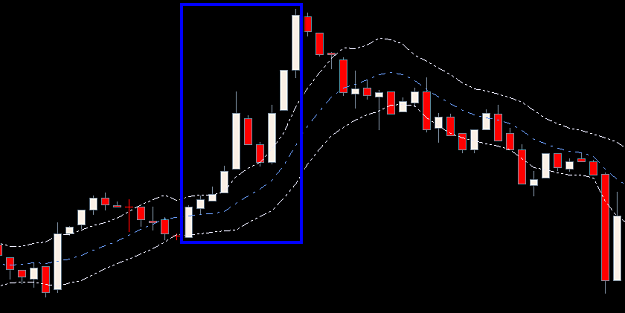
i trade weekly chart so if that chart is weekly i will buy at A and sell at B (arrows) due to the nature of weekly or longer candlestick chart i have more time to relax and see it more clearly (cuz i dont like to sit all days or everyday to trade...so i only trade/pending on monday then let the chart/price go where it wanna go) but since its M1 chart lol i have to surrender good luck bro
Interesting exercise. I guess since you have let the cat out of the bag and told the participants which is the real trade and which is the fake, my response should be kinda late.
But for the sake of discussion (and I swear I formed an opinion before seeing your most recent posts)
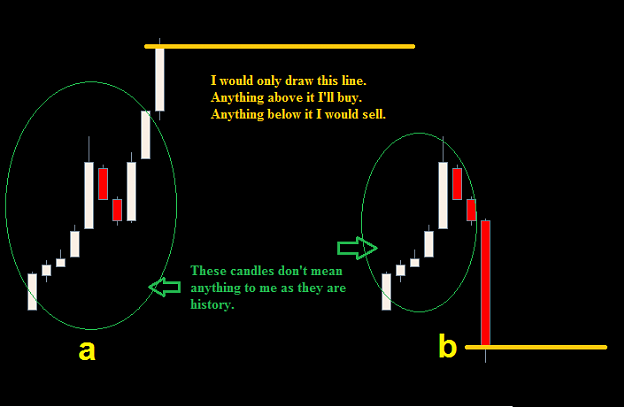
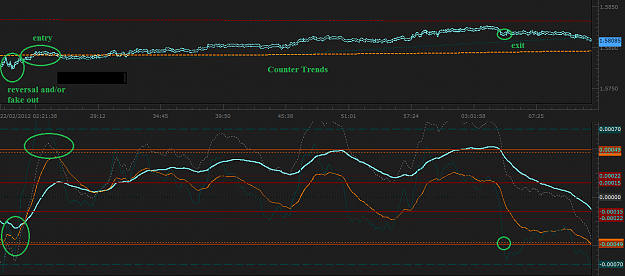
I would have voted to have "A" as the real chart. Also it is the most tradable chart. There is a valid breakout potential to trade on chart "A".
On chart "B" there is no valid patterns, no valid candlestick formation. There is no logic in that chart. Meaning, the only reason chart "B" could have formed like that was if that sudden shocking news happened. And by shocking news it could be something like benanke died.
Price needs to consolidate or retrace slightly after a trend. It will almost never do something like chart "B". Even on the 1 minute charts.
If so, you can see that price crosses your combo for the first time, pull back and continue for a while.....both long or short. This observation of price behavior led me to the conclusion that price looks for its balance.
Ignored
Price goes from efficient to inneficient over and over again, clearly seen through deviations. Be it your a growth or value trader, you aim to exploit these reocurring inneficiencies in a consistant manner. The question here is:
What 'could' lead to a tipoff, that price is not moving according to plan?
Before taking any of the both formations as trade trigger I would look for what stage price is in...at the beginning of a cycle? or is it at the end of one? pushing away from its balance or coming back at it.
Almost always the other way around. Shorter and shorter timeframes and more indicators and more analysis, yeah that is what I need to do.
Ignored
Other than spread, timeframes are all the same.
But of course someone with no proven statistical edge/s will trade non-stop till they empty their account. The only difference here is that higher timeframes will prolong the inevitable.
I guess since you have let the cat out of the bag and told the participants which is the real trade and which is the fake, my response should be kinda late.
Ignored
Nope. it wasnt really an issue about which one is real and which one is fake.
It was a case of...providing we have 2 identical movements (yet one goes up and the other goes down) could you detect the underlying differences between them both?
If so what would you be looking for/at?
Thats the point of this exercise, irrelevant of showing the real from the fake.
There is a valid breakout potential to trade on chart "A". The only reason chart "B" could have formed like that was if that sudden shocking news happened. And by shocking news it could be something like benanke died.
Ignored
Absolutely. One observation would be imminent news around the corner, a potential 'tip-off' that things will get volatile.
But the question remains: What else (other than news) would you look for to dissect 'differences'?
Price goes from efficient to inneficient over and over again, clearly seen through deviations. Be it your a growth or value trader, you aim to exploit these reocurring inneficiencies in a consistant manner. The question here is: What 'could' lead to a tipoff, that price is not moving according to plan? Care to elaborate?
Ignored
Great thread. Would have went with A based only on PA......... What do you mean by "efficient" and "inefficient" in this context? Sorry if this is a noob question but interested how prices can be efficient or otherwise.
My view is that all we have have is momentum and need to quantify that somehow as CP states. I use a BB and when price diverges two SD from its mean (somehow measured) you would expect the next move would be back towards that mean, central limit theorem etc. What happens repeatedly is that the initial impulse has enough momentum to keep PA at the outer limit of the band. This is the fat tails that people who study forex find when they test if forex prices are normally distributed. Working on finding a better quantitative measure of momentum.
Other than spread, timeframes are all the same.
But of course someone with no proven statistical edge/s will trade non-stop till they empty their account. The only difference here is that higher timeframes will prolong the inevitable.
Ignored
Except I trade over hours to days which means on average 1-5 trades per week.
Someone who trades using a M1 chart I would guess averages a helluva lot more than 1-5 trades per week. Otherwise why put in all the time staring?
Interesting point of view. Your essentially looking for 1 candle (mother) along with direction.
What else do you think is possible?
Ignored
ANYTHING is possible...the basic idea here is your bias on the market. That bias is very difficult to determine based on so little market data. If you use ONLY the candles given then I would say the bias is long. Thus in the first example you would have a small lead on the market, and in the second example you would not have entered.
If you were open to any direction and had a short and quick profit target, then either direction would work. The point here is that you've illustrated a classic and reoccurring market pattern...on of consolidation.
Which way the consolidation will resolve is almost always anyone's best guess. Thus it depends on YOUR view and YOUR beliefs as to whether you think the market will continue or reverse.
Another point is that if your view of the market is this myopic I suggest looking at more data...larger time frames, or at least 100 candles of information to try and get a better idea which way the market may be likely to move.
Price goes from efficient to inneficient over and over again, clearly seen through deviations. Be it your a growth or value trader, you aim to exploit these reocurring inneficiencies in a consistant manner.
The question here is: What 'could' lead to a tipoff, that price is not moving according to plan?
Ignored
Well I think I don´t get your question quite clearly but I believe that round numbers or/and Fib levels could lead to such a behavior. Besides of course the urge that price have to find balance before moving.
A lot of traders know that price moves when it loses its balance:
more buyers than sellers, price moves up.
more sellers than buyers, price moves down.
After moving it has to find a new balance first where it will be resolved if it continues or reverses.
So if we know that we can see the "stages of movement" .....move, find balance and move again.
Sorry for the bad English I hope I could explain my thoughts clearly.
1. It is wrong to assume and predict whether A or B will continue or not. At this stage I couldn't care less whether it will continue or not.
2. According to "Quantum Superposition Principle",
any object can not be located as they are in infinite potential possible location,
until you fixate your attention to it and then it collapse into a single position.
Inserted Video
3. Both A and B has the potential to go up and down
Important Note: These are not for sale. I will never ask money from anyone. Anyone who proclaims to be me or in association with me (CrucialPoint) are scams. Do not pay any money to anyone proclaiming they have these algorithm as they will never be for sale... ever.
***The indicators used here are NOT for sale.***
***These are exclusive and will NEVER be available to the public***
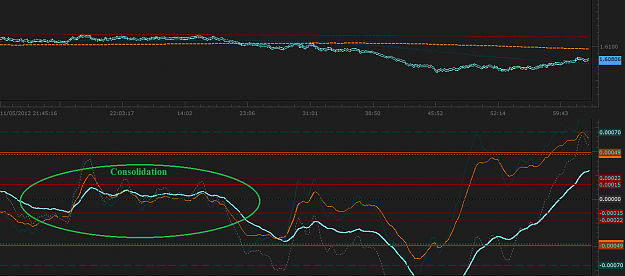
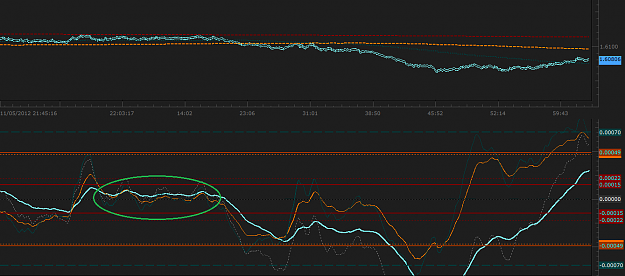
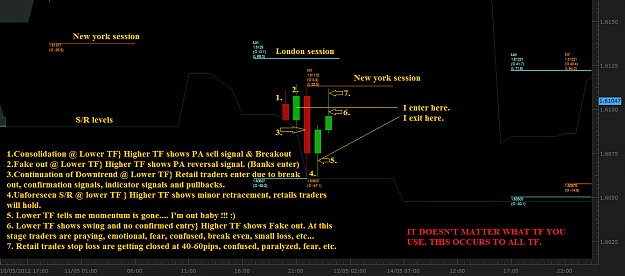
1. Consolidation
Attached Image (click to enlarge)
This is one example of "when to trade and when not to trade". No money coming in and no money coming out. Trading in such market condition is like jumping in a shark-infested waters. Don't predict weather there are sharks or no sharks present. You need an objective tool to show you this. In my trading, I can clearly quantify the money coming in and the money coming out.
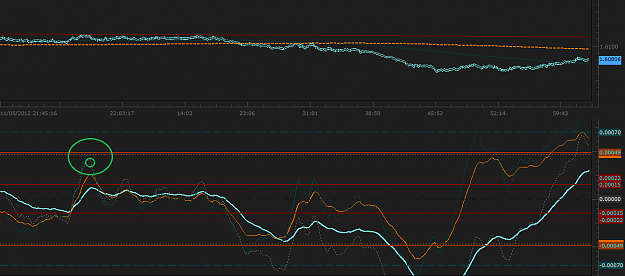
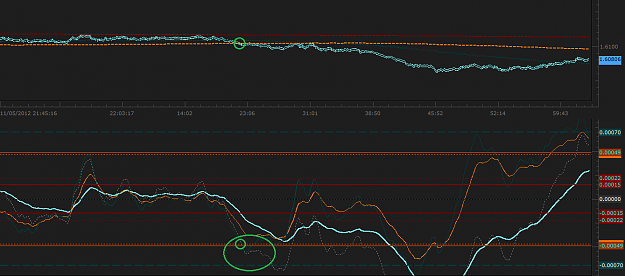
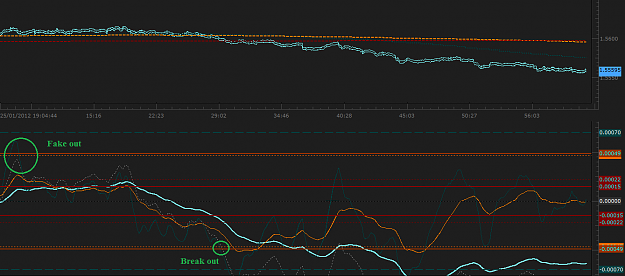
2. Fake Out
Attached Image (click to enlarge)
In this example, your standard indicators and price action candlestick pattern will trigger a buy entry. I can clearly quantify that there is not enough money to push this through and I will stay away from this entry.
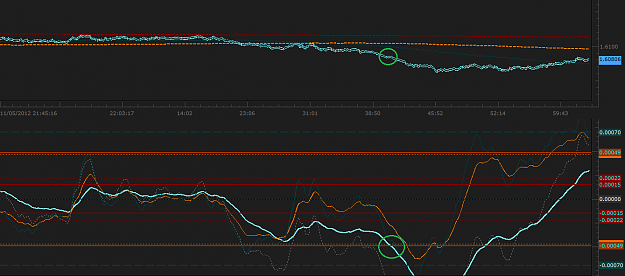
3. Institutions and Banks
Attached Image (click to enlarge)
At this stage, big players/banks are making their move and nobody can detect this... Nor can I.
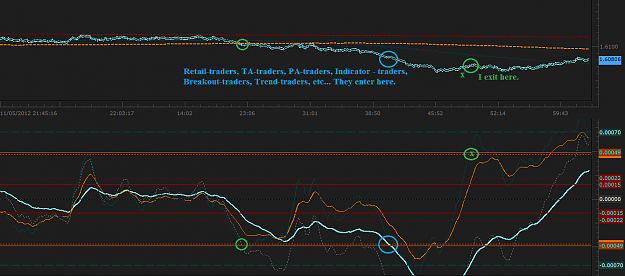
4. Momentum detection
Attached Image (click to enlarge)
At this stage standard indicators will never detect the money that just came in from the big players. My indicator can quantify such influx and triggers a signal. I enter here, while everyone (retail traders) are still waiting for a confirmation, a breakout, a signal, an omen, etc... I am in before everyone else.
5. TA, PA, Indicator, Retail traders
Attached Image (click to enlarge)
At this stage, Technical analysis, Price action, Candlestick Patterns, Retail traders gets a signal to come into the market.
6. My Exit
Attached Image (click to enlarge)
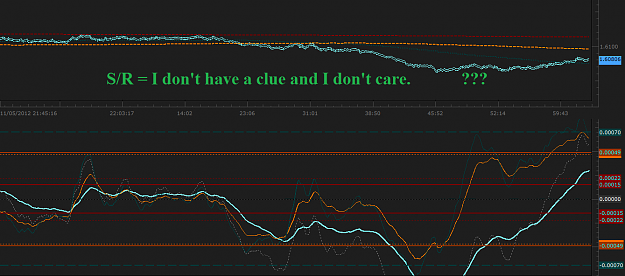
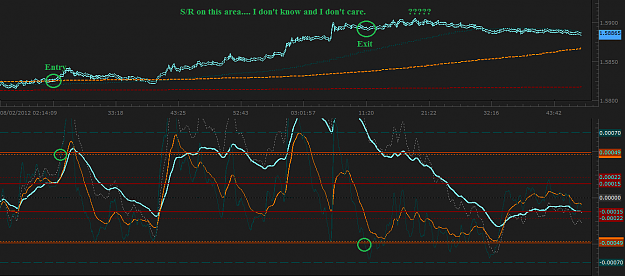
As my indicator can calculate the influx of these money coming in and out. It already quantified that there are no more money coming in. It then triggers my exit. I exit. I exit not due to some line, not due to some pattern, not due to S/R, Not due to psychological numbers... I exit because no-one is laying money on the table. I'm out Baby!!!
7. Support and Resistance
Attached Image (click to enlarge)
At this stage, professional big/bank players can do whatever they want. Not due to SR, not due to some line, not due to fundamental reason, but due to whatever you want to call it irrational predictable illogical and logical reasoning. For all I care, they probably needed to take a crap in the can so they had to close their position. But I can guarantee you, it is not because of how beautiful and how perfect your analysis were.
So, let's see this on a Higher Time Frame, shall we?...
Time of day(liquidity reasons), economic releases, sentiment of the market ALL have an effect. Then there's order structure around that level.. A's side could be floating up during highly liquid hours without a reason to sell. Maybe even trapping bears who fell for the candle pattern to add the fresh demand for buying liquidity. B's could've ran up with buy stops via NT option tripped in to sellers which made it so easy for price to fall during times when liquidity is scarce.
The possibilities are endless to what is going on within those candles. Knowing what's happening outside the charts is what separates those high probability trades from random ones.