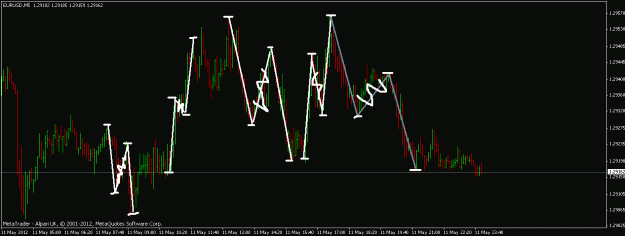
DislikedIffy - I've been followin your youtube stuff - I've marked up the following charts with what I see.
Question 1 - do you still advocate this approach?
Question 2 - if you (or others) have time, have I got it about right?
Question 3 - what (vital) clues have I missed?
Thanks to all on the PIE threads for your patience and wisdomIgnored
1. The approach is still sound - It's a great way to always be aware of the story of price, from the macro to the micro.
I am, however, currently working on a way to make it even easier to know when to enter, hold, and exit, giving the greatest possible return on the trade. More on that later
2. I haven't studied your analysis totally, I'm sorry, but from what I see, you've got a really firm grasp of the ongoing story of price, so, well done
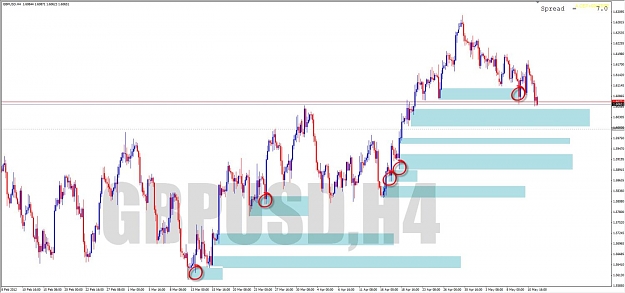
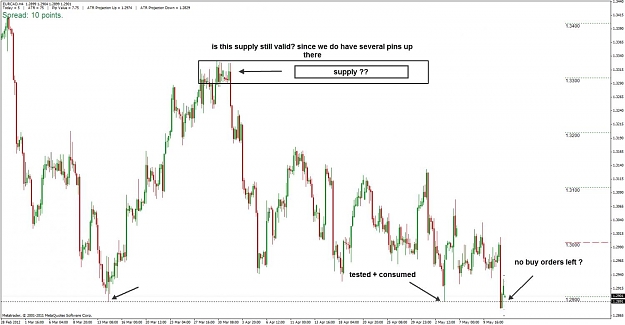
3. The one thing I did notice missing wasn't missing at all! In the H4 chart you posted (and thanks for using the Symbol and TF indi - makes the viewer's life much easier), the last CP you drew rising north is not a clean CP at all - there are a few little pockets of demand left untested.
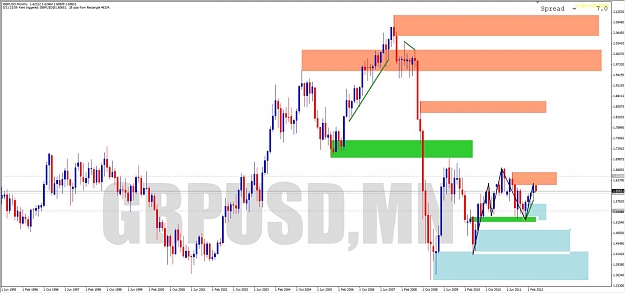
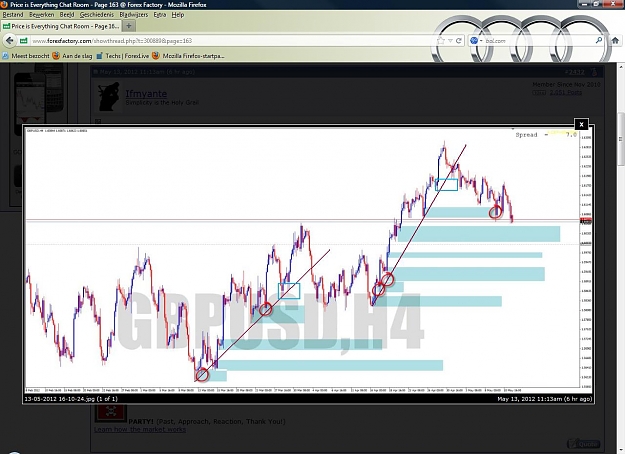
But, if you look on the monthly chart, that whole zone is clearly compressed from D up to S, and in this case, you'd imagine the HTF PA should ultimately prevail if price drops into the CP zone, especially since MTH PA has reacted to the QM level.
You've done great work on this, well done, and I hope to be seeing more of your analysis in the future.
You may confuse me from time to time though, as you share the same avatar as my friend Adilius07.
For reference, here's my picture of the story on Monthly
Attached Image (click to enlarge)