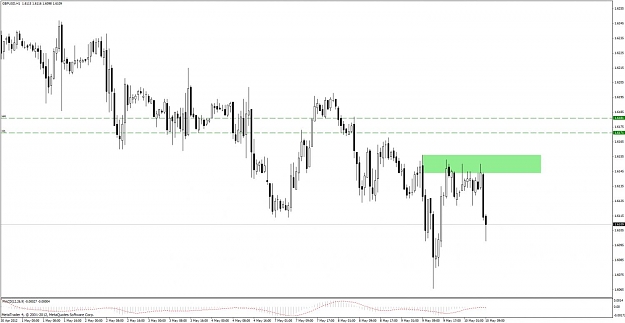
DislikedStarting to study some s/d concepts....this is my first shot at marking up a chart. CADJPY, Daily S/D zones.
Green rectangles represent the Demand zones as a I see them, looking to buy here.
Red rectangles - supply zones, looking to sell here.
Any feedback appreciated.Ignored
About the zones you marked on you chart..good but you have to consider even some other things, S/D zones are important, but if you wonna read the price you have to consider at least
1) How price leaving a S/D zones, whit a big momentum or in a more "gentle" way ? There is a retest of the zone ? Whit spikes ? Or price have found resistence/spupport belove/above the zone ?
2) How price is approaching an S/D zones ? Is compressed ? has momentum ?
3) Time, how many time price have spent in a zone ?
4) History !!! Is a fresh zones ? How price reacted to the zone in the past ? What's happen in LTF ?
But that is just the beginning..enjoy the journey!
Sometime the horizon disappear. Twitter: @_whiteout