[quote=MitchWorse;5651770]The reason why i was looking for a buy was that i was too late to sell and price was at demand.
Not selling at demand, so i'm just watching and looking for buys...missing the good stuff
hi mitch!
just as you, i see this pair on a daily demand level so i cant go short .trying to identify where i might see a bounce i go down to 4hr chart to try to identify better the zone.
i have marked 2 zones.what do u think ?are they valid zones we might see a bounce?
obviously im not just gonna go long when price arrives but was wondering if this is something u are looking at as well.
thank you for any feedback.
seems there's zero demand on the euro not even a decent bounce
Ignored
fortunately for my little demo account, no.
but if you look and the montly charts you will spot a gap in the LCS, and price bouce near that level, is because of LCS ? who knows.
Attached Image (click to enlarge)
Sometime the horizon disappear. Twitter: @_whiteout
fortunately for my little demo account, no.
but if you look and the montly charts you will spot a gap in the LCS, and price bouce near that level, is because of LCS ? who knows.
Ignored
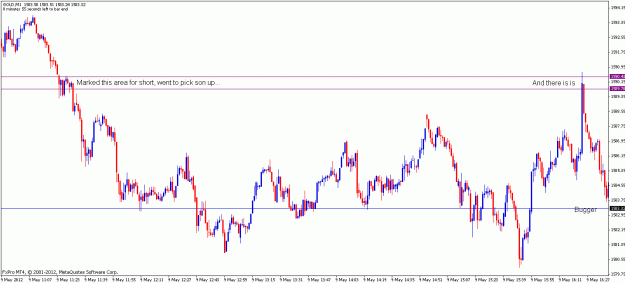
I marked these out earlier. had a buy limit set at 2907 but it missed. i wanted the lower box really but look how this stuff works. superb. Gave me the heads up to close some of the short at least and bank full profit on some of it. I really wanted to try one of kenny's locks on this but, another time
fortunately for my little demo account, no.
but if you look and the montly charts you will spot a gap in the LCS, and price bouce near that level, is because of LCS ? who knows.
i tend to pick the wicks of the pivot or momentum bars as S/D.
The question i keep asking myself: where did a move start.
Battles are fought at strategic points. So is the struggle between buyers and sellers. When one side loses a battle, it retreats to a safe place to pick up the arms again and regroup.
Joined Dec 2009
|
Status: I'm not a guy...
|240 Posts
Hi guys,
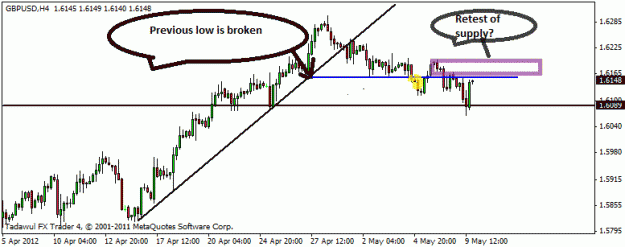
Here are some charts of GU,
We had the break of a previous 4h low today and got a new supply level at the area. Price then retraced to it (now). Let's see how this trade will develope.
We had the break of a previous 4h low today and got a new supply level at the area. Price then retraced to it (now). Let's see how this trade will develope.
Any comments are welcome.
Mel
Ignored
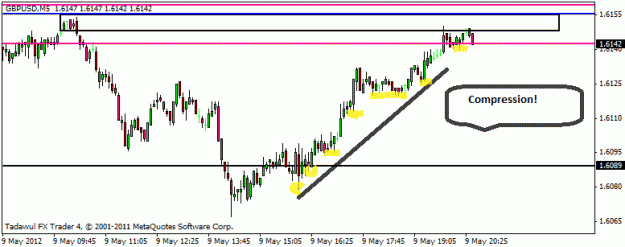
Be careful with zone from H4 and higher one from H1 - they were spiked already. No strong reaction from m5 zone but this could be nice trade - scalp at least
Starting to study some s/d concepts....this is my first shot at marking up a chart. CADJPY, Daily S/D zones.
Green rectangles represent the Demand zones as a I see them, looking to buy here.
Red rectangles - supply zones, looking to sell here.
Any feedback appreciated.
Starting to study some s/d concepts....this is my first shot at marking up a chart. CADJPY, Daily S/D zones.
Green rectangles represent the Demand zones as a I see them, looking to buy here.
Red rectangles - supply zones, looking to sell here.
Any feedback appreciated.
Ignored
Hey D, nice to see you visiting here . Some good stuff within. If nobody else gets to it, i'll answer in the morning m8, got to switch off now. Long day.