Hi Fxgroup
Just discovering your thread and starting to go through it. So far I find your simple approach really enlightening.
One question : since close and open of candles are so important, what is your recommendation, since different brokers will have different closing and opening hours. For example, my broker is based on GMT and I cannot change the setting. I know of other brokers based on GMT +2.
Another widely accepted idea for end of day in forex is the time of US close, that is (if I am right) GMT -3.
Thanks a lot for sharing your experience...
Ignored
Hi Bluejay and welcome !
Yes is true..the D candle close could be different based on different brokers, but anyway the market structure's are the same: RM, trend, congestions, etc.
Since my trading style is looking for higher TFs, becomes less influenced by the candle close.
A chart is a chart and the price is price on any chart and the price will always do what is has to do ,since one trader woud have a PB, another will have a BUOB/ BEOB or a DBHLC/ DBLHC...but the price will always tell us the same story...all we have to do is to look beyond the candles and read the price !
P.S. We don't have to trade all the market situation, but only those when we understand WPD+WPG..we have always the choice to choose !
Thanks Fxgroup for your answer, you are confirming what I was gradually getting to. Still, sometimes it is not so easy to recognize clear levels, but then I suppose that according to your philosophy, we should go for another pair which tells us clear things !
Thanks again, I will go on through your thread with much interest
Ignored
Most people prefer that the daily candle close coincides with the NY market close, as this is the unoffical end of the trading day.
And most brokers do use this closing time as far as I know.
A few you can look at that use this time are: FXPro, Hot Forex, Alpari UK, Pepperstone.
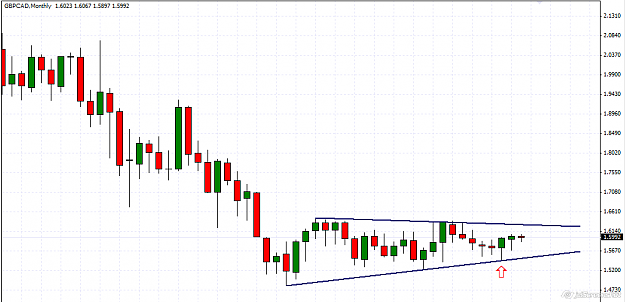
GBPCAD
The P is within the dynamic M RM..where the last 2 months closed as a PB/ BUOB at S level...the last W candle closed as a fight between the buyers and sellers for 1.60 very important M level+ BRN....all we have to do is to see the price pushed out of the W RM and a buyer's confirmation.
|
Joined May 2010
|
Status: Always Learning
|534 Posts
Hi FxGroup,
Just wanted to stop reading your thread for a Moment to say Hi and Thank you for a Wonderful thread. Just found it today and have been Reading it like a really good mystery novel. (I know what I am doing this weekend ) I have a general knowledge of your trading style, but you have really helped me focus on the important things to look for. Have nothing to contribute yet, just wanted to say thanks.
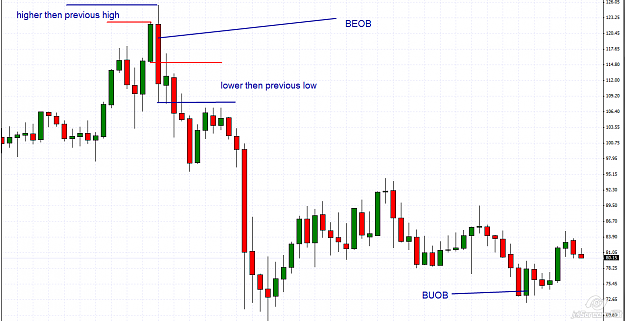
M: down trend, Outside bar: seller control, return to down trend
Hi oliver.....the M is non a BEOB....in order to have a BEOB, the high and the low have to be outside (higher and lower the the previous candle's high and low) by the previous candle....an exemple on my chart !
USDJPY- looking for 79.50 and 78.15
If we have the skills and the patience to look for something like these on higher TFs with D RETs...all of a sudden become simplier and more profitable !
Ignored
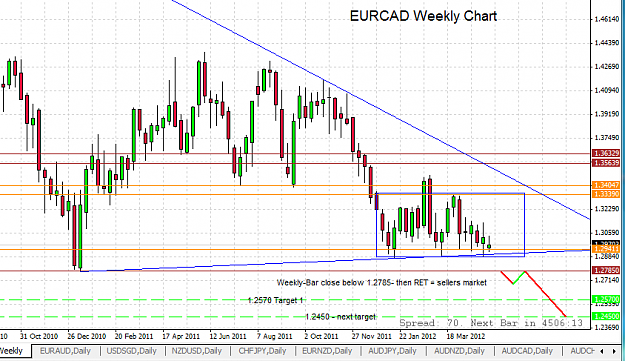
looks at weekly chart, WPG should be 0.8476. If so, price did not make it this time.
looks at weekly chart, WPG should be 0.8476. If so, price did not make it this time.
Ignored
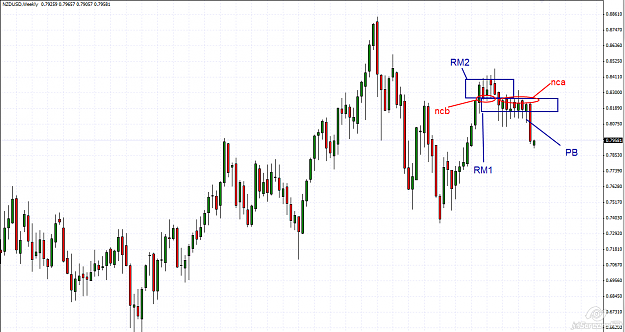
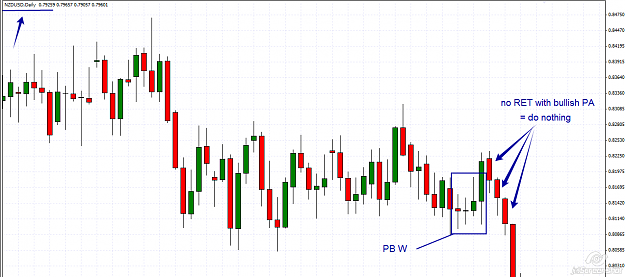
On the W chart we had a PB in RM 1..so we had to wait for a D RET+ bullish PA in order to push the P up to the RM 1 R....and looking to D chart we notice that we just simple hadn't it !
Have been studying this market method quietly on the side line with great interest.
Never been happy using indicators and this way seems to fit me well.
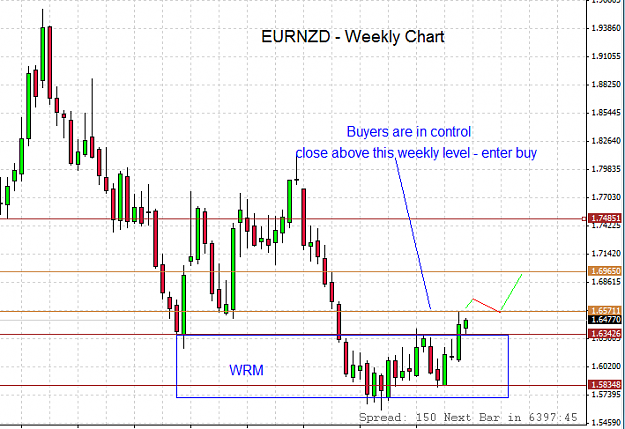
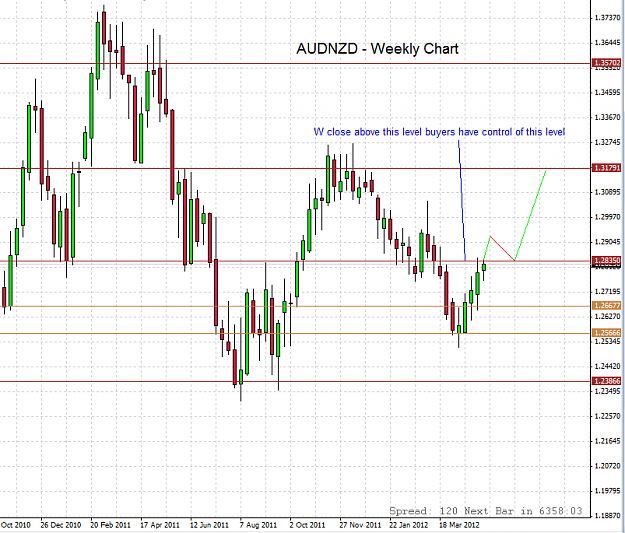
Please see attached chart, is this a reasonable assumption for if and when the next trade should take place?
Peter.
Ignored
Hi Peter and welcome !
EURNZD-with the P at R 1.6530 and in dynamic RM..if it close above it then 1.6960 becomes the very next target.
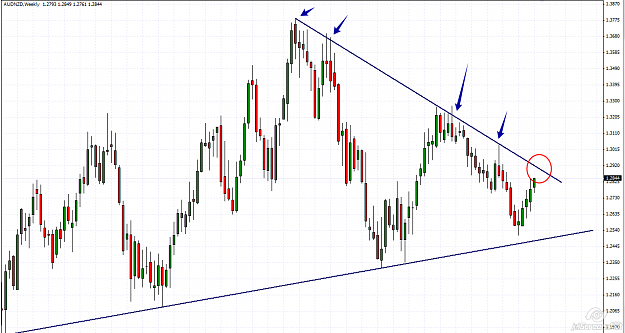
AUDNZD-...more complex ...watch closely 1.29+1.30 MM levels but most of all the dynamic R !
P.S. Very nice charts !...notice how the P didn't has a good momentum in the bullish fase because of the lack of a bullish PA at the S level !
|
Joined Sep 2007
|
Status: Never give up
|173 Posts
Thanks fxgroup for your reply
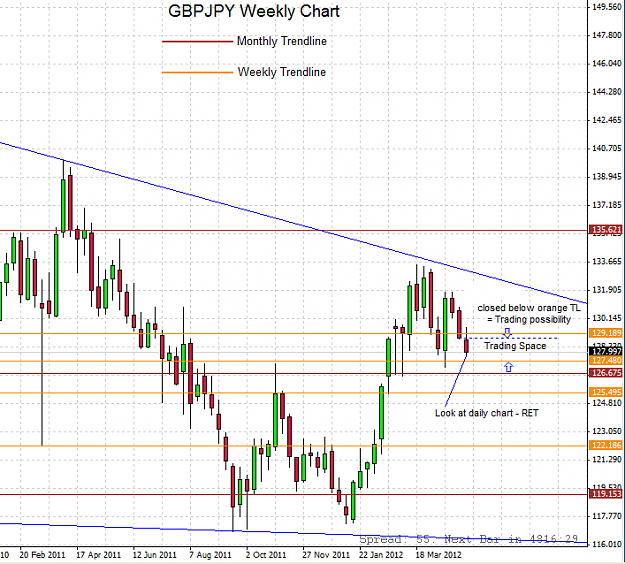
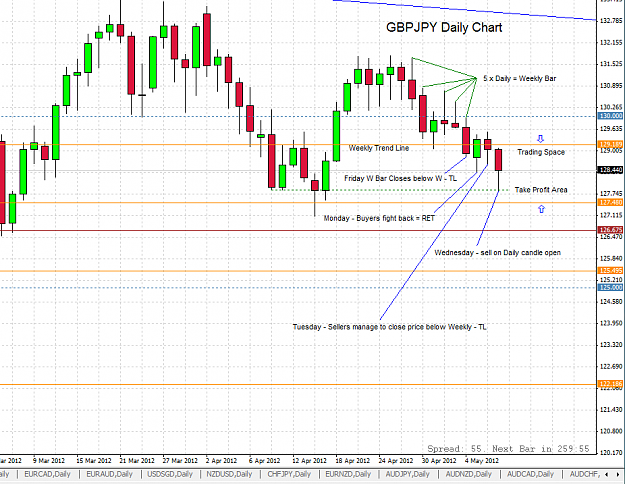
Attached are two charts, have I got this right?
I have been practicing drawing trendlines and trying to work out what WPD and WPG this method does paint a clear picture - ( I do realise this is after the fact) - and should be currently in the market with a sell...but plenty of time for that later.
|
Joined Aug 2010
|
Status: Roaring in a cave near you
|237 Posts
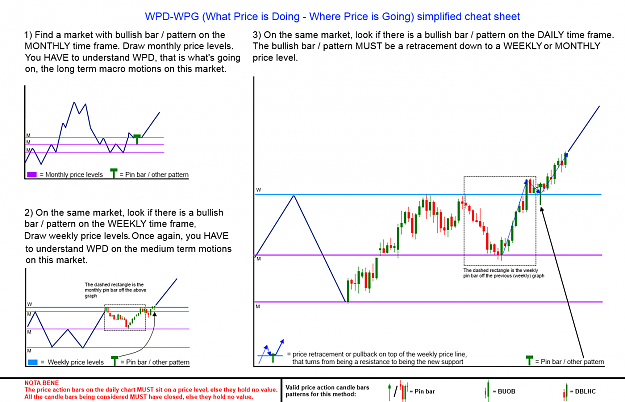
I decided to mirror here a method cheat sheet I created for my own website, which in turn contains a work in progress of what I have understood about the method so far.
- - - - - - - - - - - - -
WPD-WPG method cheat sheet
The following picture shows a cheat sheet about the trading method teached in this course. This cheat sheet shows a sample of bullish market, a buy operation and bullish patterns. For bearish markets the method is the same, just flip the graphs upside down and use bearish patterns.
How to use it:
1) Print the cheat sheet.
2) Have several markets available. The best trades don’t always happen on the same market, some times a market might spend months doing nothing relevant. The trader is meant to keep a basket of markets where to pick the best trades.
3) Look at the cheat sheet top left. Draw the monthly price levels and try and understand what’s going on in the market. One of the most important informations is to understand whether the market is going up or down.
4) Look at the cheat sheet bottom left. Draw the weekly price levels and make sure the weekly price is concording with the monthly.
5) Finally look at the cheat sheet right. Find a trade trigger price action pattern that sits on a retracement on a weekly (or monthly) price level.
Very important:
- Only closed bars are valid and relevant. Example: a weekly bar only closes at the end of the week. This means that before the end of the week you are looking at an half created bar which is irrelevant and potentially confusing. You have to look at the bar before it, since it’s the closest closed bar.
Same for the daily chart: looking in the middle of the day only shows half made and irrelevant bars. You have to look at the chart at the beginning of the trading day or to ignore the forming bar and look at the one before it.
- Price action bars patterns require a context and location. A bars pattern in the middle of nowhere has zero meaning. A bars pattern sitting at a price level is the only kind to consider.
Hi fxgroup, really good thread you have here (I´ve already ready read twice the whole thing), imo it´s one of the best threads here on ff (together with j16 chart thread which i´m also studying). So thanks for your effort. Hopefully I´ll be soon ready to post some charts.
dfumagalli
thanks for this cheat sheet i´ve already printed it out, also thanks for your other posts.