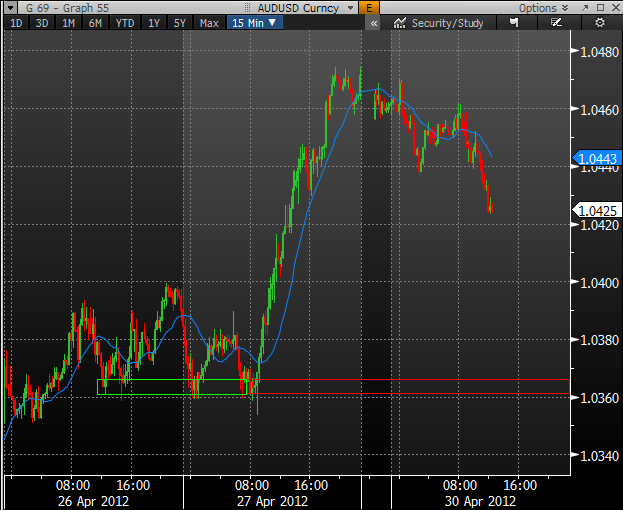
How do people see this level? Is it fresh or not given that price has already bounced around that area previously.
Ignored
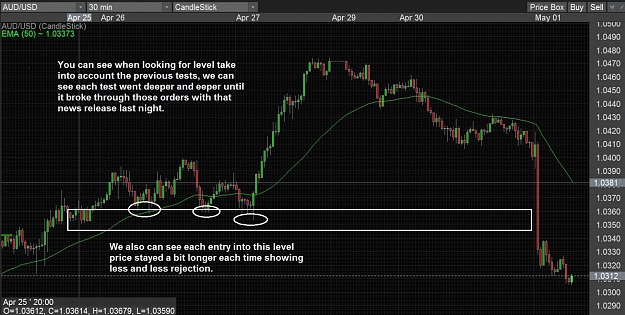
The level you have given is not fresh, price has bounced about 3 times from it, but it still might offer some support. There might be other levels on the way down though that price based at on the way up but they continued upward. A good level doesnt always have to be at the bottom of your chart.
Joined Nov 2008
|
Status: Trade Inspiration Not Despiration .
|4,827 Posts
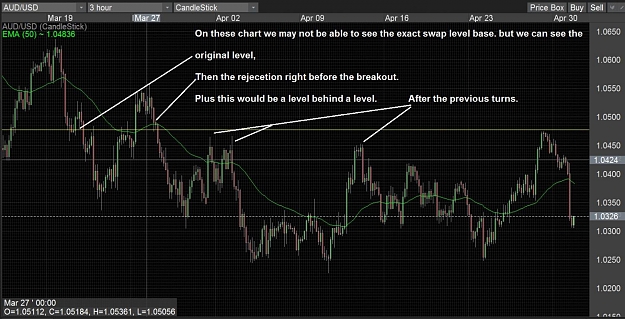
Hint in Sam videos he takes level based off a very fast chart, Why because this is where a turn shows first. So even if these look very shallow. On a fast chart they wouldn't. But that isn't the answer only a explanation.
Even up the wick on a pin off a 1 hr candle we can find levels that show the turn if we want to. but the key is not those fast levels.
Did my end of month review for my first complete month of S&D trading.
The results were +36% based on 2% risk per trade. Obviously thats a great start but it's actually slightly frustrating because I had an 8% drawdown in the last 3 days of the month where I hit a really bad run of trades.
I think it's possible to improve on that greatly and 50% a month is a very achievable target on a consistent basis in my opinion. I can spot multiple trades I took that I shouldnt have which would increase the strike-rate, and I also think that once you cut the silly trades out, you could comfortably risk 3-4% per trade to increase your overall return greatly.
Here's some interesting (I think so anyway!) points I picked up from my data.
My DBD and RBR trades (i.e trend continuations) were good for +40%, and my RBD and DBR trades (reversals) were -4% overall. I found that odd because Sam suggests that the RBD and DBR trades are the strongest, obviously I need to put some work in and work out where I've been going wrong.
My first thought based on going through my screen-shots is that the trend is the issue. I trade the 30min timeframe, and on quite a few of my losing DBR and RBD trades if I go up to the 4h I can see that I'm clearly trading counter-trend. Obviously with DBD and RBR trades you're naturally with the trend nearly all of the time anyway because of the nature of the trade.
I've also found that a common mistake is trading non-fresh levels, and particularly trades where you draw your level in, then the market comes to within a few pips then goes away. Quite often I leave my trade in but in hindsight, in those scenarios the pullback has probably taken a lot of the supply/demand away so weakened your trade.
Another consideration for me is that maybe I'm being too relaxed when picking out "areas of massive rejection". I think quite often I take anything where the market has moved fast, whereas massive rejection suggests I should only be looking for trades when it REALLY stands out on the chart.
Any input from anybody always welcome, really want to work out how to improve these DBR and RBD trades.
Hint in Sam videos he takes level based off a very fast chart, Why because this is where a turn shows first. So even if these look very shallow. On a fast chart they wouldn't. But that isn't the answer only a explanation.
Even up the wick on a pin off a 1 hr candle we can find levels that show the turn if we want to. but the key is not those fast levels.
Ignored
Been watching a lot of Sams videos of late, seen one where he uses bollinger bands for the entry, did you see that one? and if so ever tried it?
also where you short aud when the news came out? That would really help your 100 pips a week lol
Been watching a lot of Sams videos of late, seen one where he uses bollinger bands for the entry, did you see that one? and if so ever tried it?
also where you short aud when the news came out? That would really help your 100 pips a week lol
Ignored
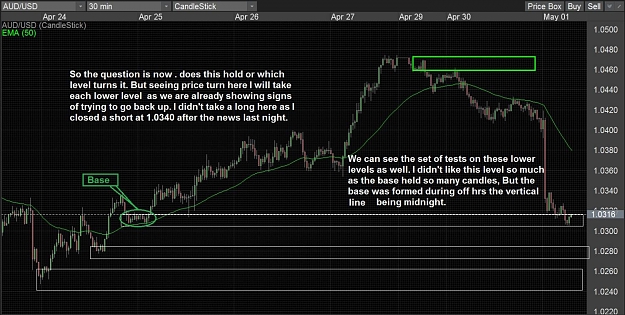
Yes I was ..,, closed it at 1.0340
Yes he calls it his all star entry ,, originally he used the cci or slow stochs , think he switched to the BB , because it prints right on the chart, they are all the same showing overbought or oversold.
But no I have never used it . Think he used it mainly on the fast charts after finding levels on a 30 min or 1 hr chart then zooms into a 2 min to find a entry.
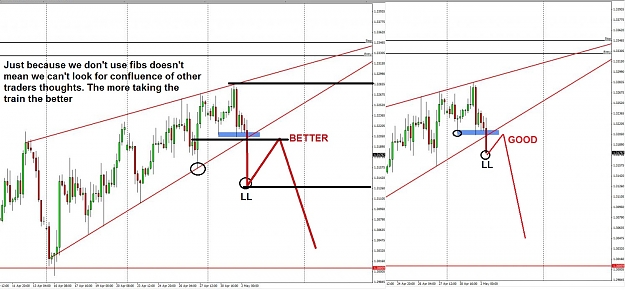
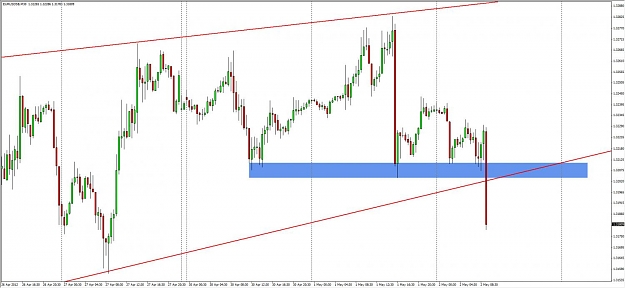
I've attached 2 screenshots of EU this morning on the 30min and 4h, this is a potential swap trade and like I've mentioned recently I'm a bit clueless with swap trades so wanted some advice.
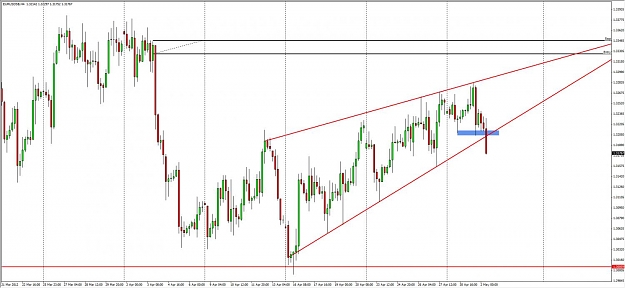
In this case there is a clear low point (that was tested 3-4 times) thats now broken out. Looks potentially good for a swap but on the 4h its clearly counter trend. The thing is though it's breaking out of the trendline, and if it pulls back in the next day or 2 it could potentially touch both the trendline and the swap level at the same time. Would you consider taking this trade, or do you still consider this to be too counter trend? Obviously there are 3-4 higher lows aloong the way in this move.
I've attached 2 screenshots of EU this morning on the 30min and 4h, this is a potential swap trade and like I've mentioned recently I'm a bit clueless with swap trades so wanted some advice.
In this case there is a clear low point (that was tested 3-4 times) thats now broken out. Looks potentially good for a swap but on the 4h its clearly counter trend. The thing is though it's breaking out of the trendline, and if it pulls back in the next day or 2 it could potentially touch both the trendline and the...
Ignored
Congratulations on your awesome results. May I ask how many trades these results include and how many/which timeframes? Just curious...
I've attached 2 screenshots of EU this morning on the 30min and 4h, this is a potential swap trade and like I've mentioned recently I'm a bit clueless with swap trades so wanted some advice.
In this case there is a clear low point (that was tested 3-4 times) thats now broken out. Looks potentially good for a swap but on the 4h its clearly counter trend. The thing is though it's breaking out of the trendline, and if it pulls back in the next day or 2 it could potentially touch both the trendline and the swap...
Joined Nov 2008
|
Status: Trade Inspiration Not Despiration .
|4,827 Posts
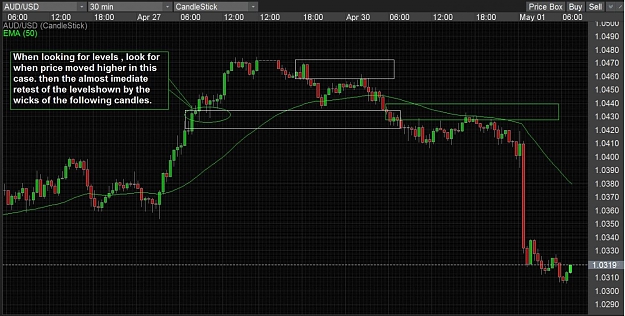
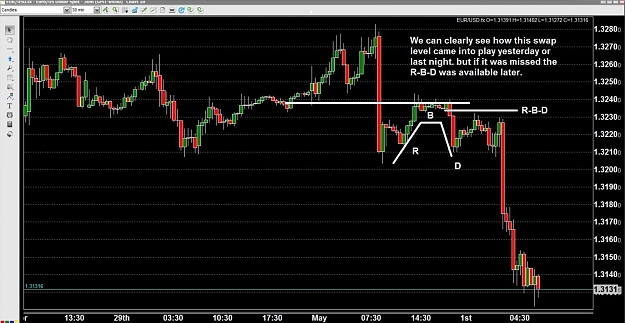
remember we are always looking for where price may go. we can see levels we may be interested in , so then the Price Action is what comes next . We just look for the Best we can find . not that real good isn't alright as well.
But when it turns back up we have to watch to see which swap level will be THE ONE. 30 min 1.3210 hrly 1.3185 or 4hr in between the others which to me carries more weight. ( or importance)
Joined Nov 2008
|
Status: Trade Inspiration Not Despiration .
|4,827 Posts
chart , it happens , at times we get second changes. or it could be when are you at your computer. But the idea is to always keep looking and learning .
Joined Nov 2008
|
Status: Trade Inspiration Not Despiration .
|4,827 Posts
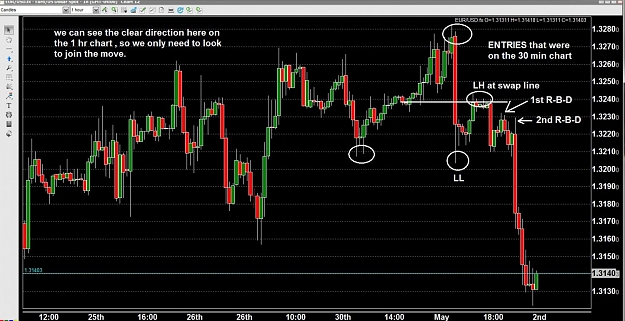
as seen on the above chart as long as you are with the downtrend change and you look for a short entry they were many even after that first R-B-D there was another one.
The first focus is always which way is price going
this we base off the bigger time frame swings. lower lows followed by lower highs . the first swap. look at your 1 hr
Hint in Sam videos he takes level based off a very fast chart, Why because this is where a turn shows first. So even if these look very shallow. On a fast chart they wouldn't. But that isn't the answer only a explanation.
Even up the wick on a pin off a 1 hr candle we can find levels that show the turn if we want to. but the key is not those fast levels.
Ignored
Ken,if there was a round # between your entry and TP would you get out at the round #..Thanks