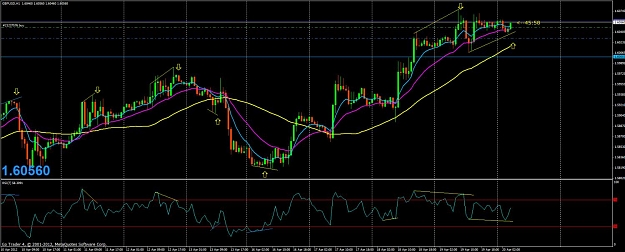
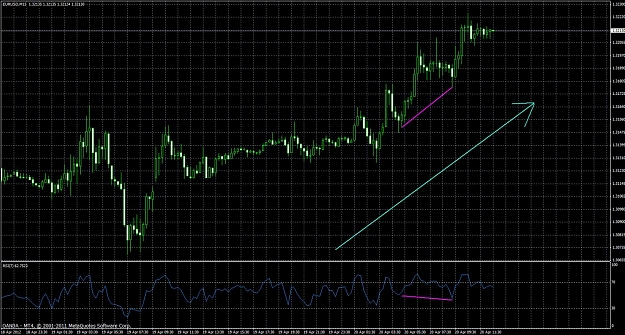
DislikedIf you don't mind I just wanted to share a picture about the Candle Bar indicators that I have recently uploaded. On the 2nd SubWindow you can see an RSI Period 7 Using bars for visibility (of course you can set it to show the RSI line also )
Just for comparing purposes.
Attachment
Best RegardsIgnored
Tools,
Thanks for posting.
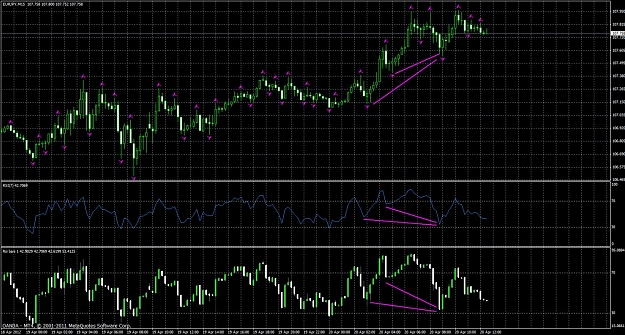
In the indicator windows for the indis you posted, it draws "candles" but they are not exactly the same as the normal price candles in the chart. What are those candles and how are they calculated and based on what exactly, and why do they look the way they do?
Thanks