Hello guys,
Excelent thread, I have to say.
I'm following the J16 thread for some time and I've learned a lot, but always struggled to implement the concept of higher TF levels on the daily chart.
Well, in here this is presented in a perfect way and for this I am really thankfull.
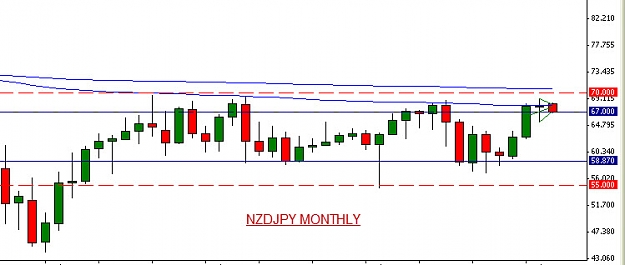
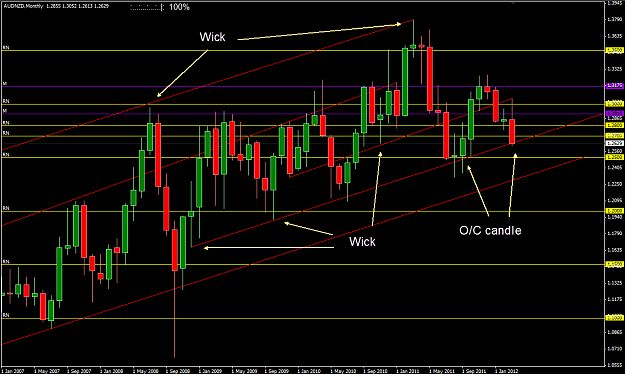
The concept of drawing levels at the candle O/C without wicks is quite interesting, but very logical, it seems to me.
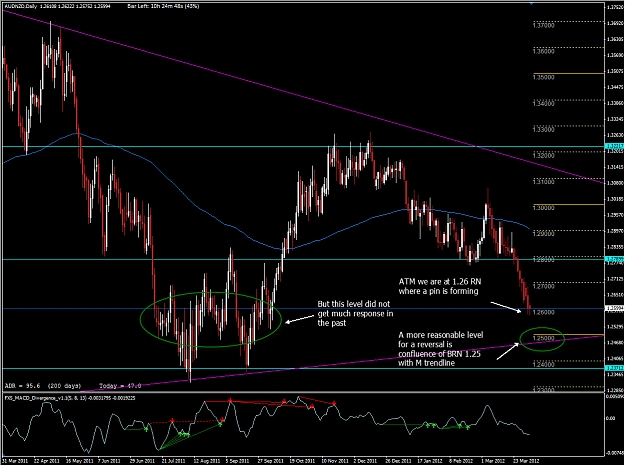
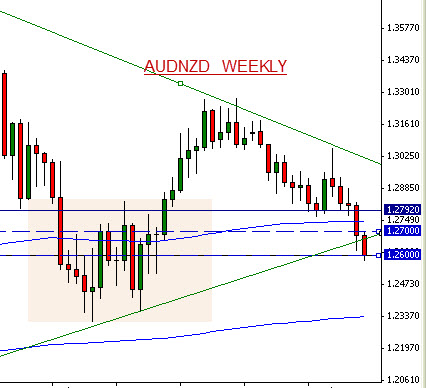
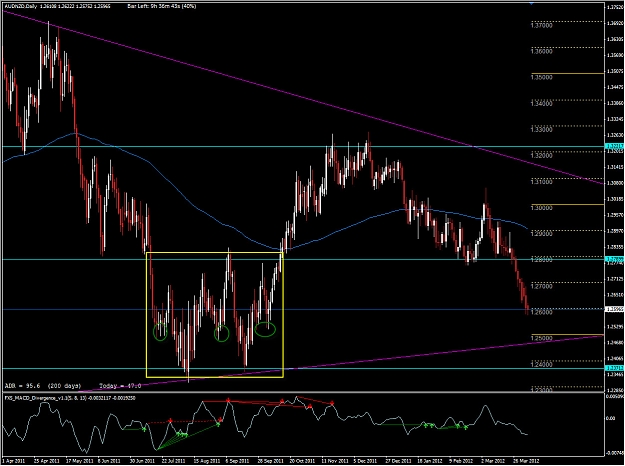
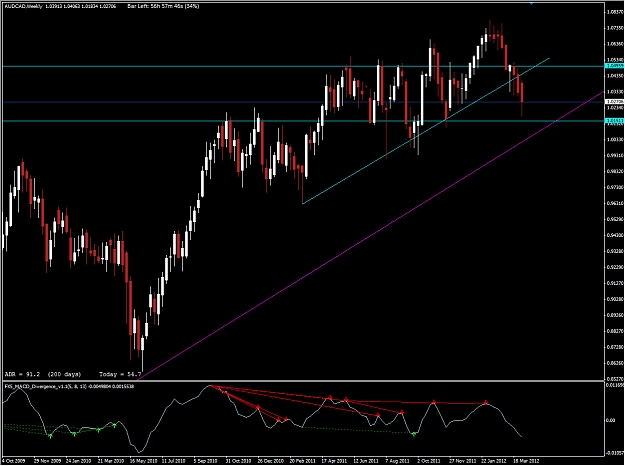
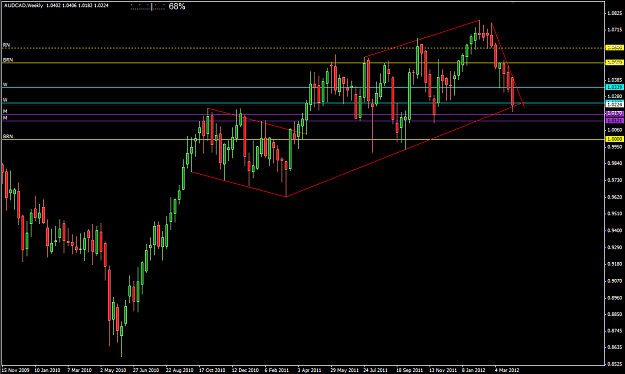
I got a question however, about drawing trendlines or different dynamic RM's.
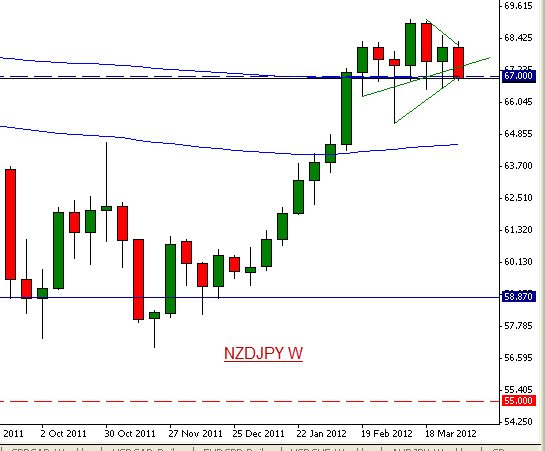
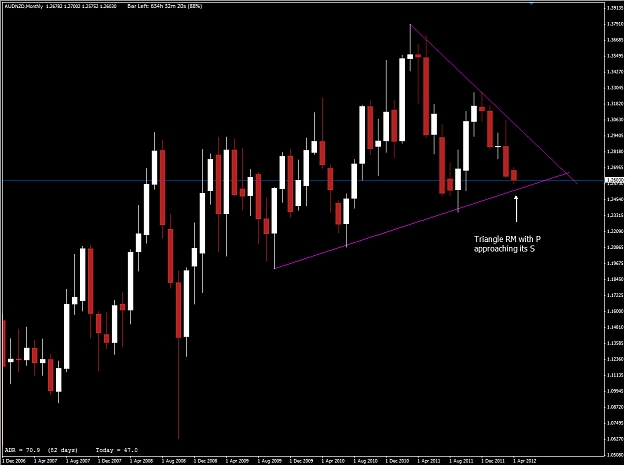
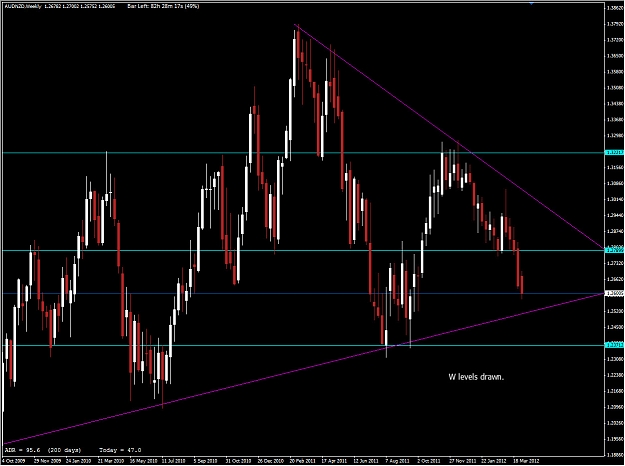
I see some pics were TL's are drawn at wicks, some at candle O/C, some somewhere in between. I guess this is not a big deal on a D chart, but talking about M, this can be few 100 pips... So I would like to know, how should I draw those.
I've taken dfumagalli's chart as an example - who btw. is doing a great job in here - to show why Im a bit confused.
Some thoughts aboutt his concept would be appreciated.
Excelent thread, I have to say.
I'm following the J16 thread for some time and I've learned a lot, but always struggled to implement the concept of higher TF levels on the daily chart.
Well, in here this is presented in a perfect way and for this I am really thankfull.
The concept of drawing levels at the candle O/C without wicks is quite interesting, but very logical, it seems to me.
I got a question however, about drawing trendlines or different dynamic RM's.
I see some pics were TL's are drawn at wicks, some at candle O/C, some somewhere in between. I guess this is not a big deal on a D chart, but talking about M, this can be few 100 pips... So I would like to know, how should I draw those.
I've taken dfumagalli's chart as an example - who btw. is doing a great job in here - to show why Im a bit confused.
Some thoughts aboutt his concept would be appreciated.
Attached Image (click to enlarge)
Thoughts are things