|
Joined Dec 2010
|
Status: Reward Of Simple Approach
|165 Posts
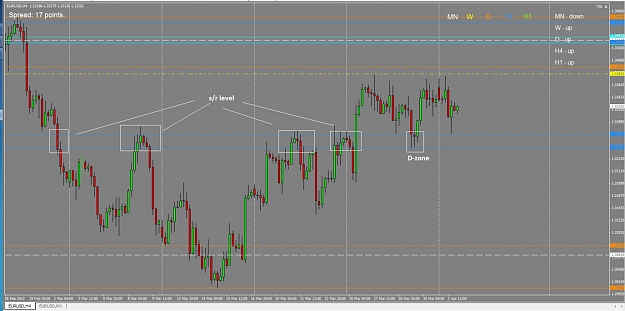
If, take a look, when I put every zone that i see, this chart is like one big mess . There is no information for me ;( and price nearly all time is in one of this zones ...
If, take a look, when I put every zone that i see, this chart is like one big mess . There is no information for me ;( and price nearly all time is in one of this zones ...
Ignored
I'll try and get the indi finished which will help.
But Rosa, not all zones are nicely separated and easy to read.
Believe me, if trading truly was easy, everybody would be doing it.
|
Joined Dec 2010
|
Status: Reward Of Simple Approach
|165 Posts
But in other view. from 1 march 2011 we are in downtrend on MN, yes ? Then price visited all Demand zones (include your two blue) so there I can forget about them and take a look for next - which is in this case my lowest white lines, yes ??
But in other view. from 1 march 2011 we are in downtrend on MN, yes ? Then price visited all Demand zones (include your two blue) so there I can forget about them and take a look for next - which is in this case my lowest white lines, yes ??
Ignored
You can look to the next zone once the present one is broken convincingly.
|
Joined Dec 2010
|
Status: Reward Of Simple Approach
|165 Posts
Yes, you are right, but there was one visit in this demand zone . And last question how you assign move in MN view ? From Supply to Demand ? I try to relate your video : http://www.youtube.com/watch?v=87GcQOK2_c0 to eurusd at this time and try to find every TF direction of prive travel.
Yes, you are right, but there was one visit in this demand zone . And last question how you assign move in MN view ? From Supply to Demand ? I try to relate your video : http://www.youtube.com/watch?v=87GcQOK2_c0 to eurusd at this time and try to find every TF direction of prive travel.
Haven't much time, so I'll just comment on your first, H4 chart.
I didn't understand it! There was a QM though. See it in H1
Ignored
I've been referencing Tyoons post where he draws us QMs... http://www.forexfactory.com/showthread.php?p=5338923#post5338923
In this example he shows price rounding with L-H-LL-LH-LL-HH-HL etc and also the simple engulfing 4 bar config which in M1 is the exact moment price rejected and turned.... i thought i'd found the QM there, nested inside the rounding down in H4.
I was seeing them everywhere i suppose. I'll find more betterer ones. It's a good exercise.
Ignored
have a look at this (http://www.hankpruden.com/MTWyckoffSchematics.pdf)
 . There is no information for me ;( and price nearly all time is in one of this zones ...