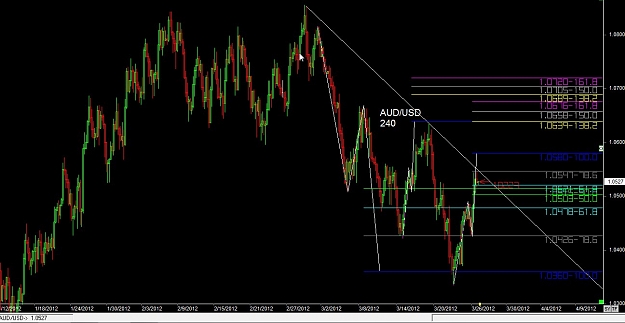
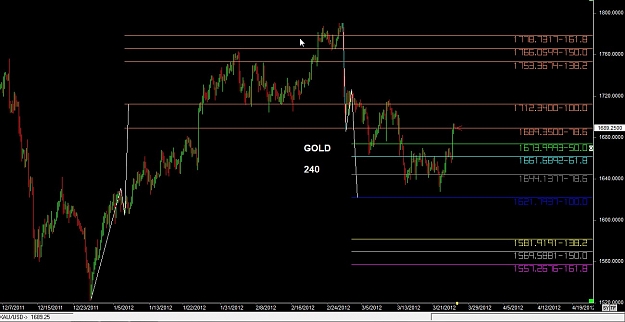
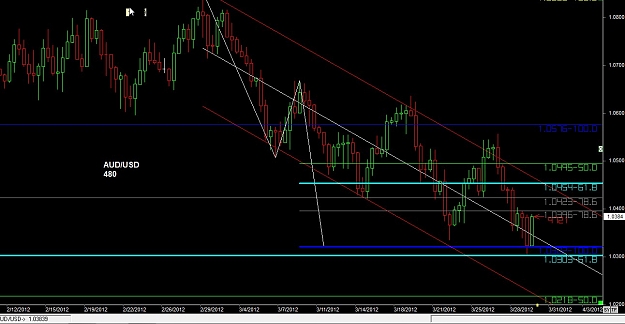
On March 22 we had our 100% Target 1 hit, then we retraced to the 61.8% barrier. Now we are near the 78.6 sub-barrier again. We know how the market moves in swings, we have our tools to read the candle targets, the market will take a break after hitting a target, we let the market tell us what is next because no trader can tell the market where it is going. All we do is read the candles we choose to look at. The market moves in technical fashion.*
This is taken from a GOLD analysis back in February.
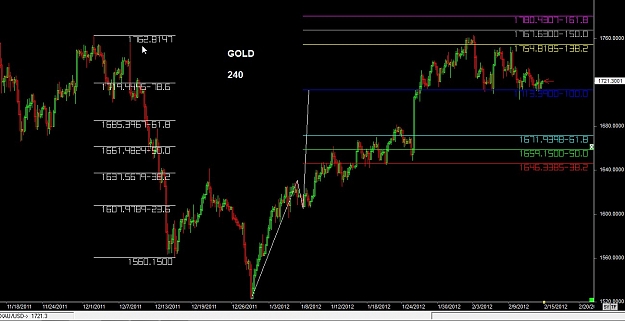
(a little review) With the Dynamic Fib, remember that the 61.8% is our main barrier. If we break above the 61.8% we will look toward Target 1, giving some importance to the 78.6 sub-barrier. Once we hit a target we can expect the currency to take a breather and have some retracement. If we hit target 1, we look to the 61.8% for possible retracement. If we break above Target 1 and find it turn to support, we will look to our Full Target 2. But we do this level by level, we have the 138.2% and 150.0% Sub-Targets on the way. When we hit these, we also have to watch for retracement to the 100%...if there is a break below the 100% we look to the 61.8%.
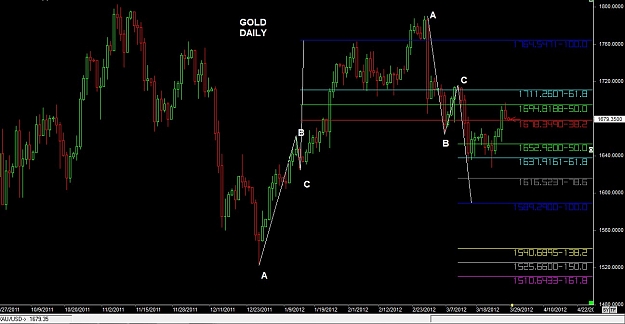
GOLD (old analysis)
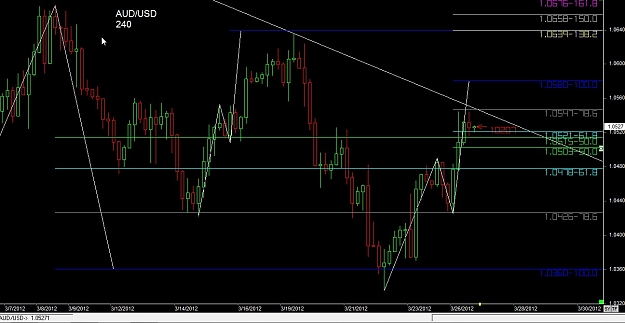
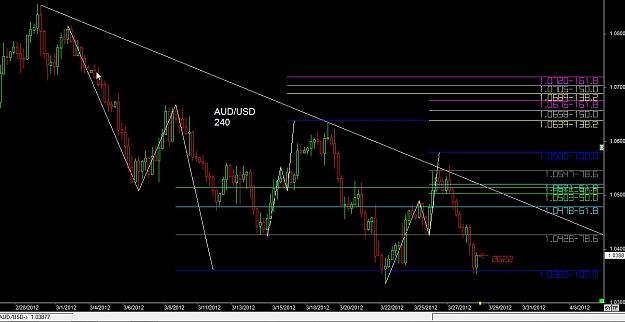
The 240 chart shows the movement that GOLD has had within our Dynamic Fib (1522/1630/1604). We had made it passed the 61.8 (1671), to and passed the 100%(1713). Then we found support at the 100% and advanced a little passed the 138.2% (1754) before retraceing to 100%. Now we want to watch 1713 area, this is our 100%. Will we stay above this area and have a chance to go to the 138.2%(1754) or will we fall below and head toward our 61.8%(1671). The 480 and Daily charts have the larger FibZone levels.
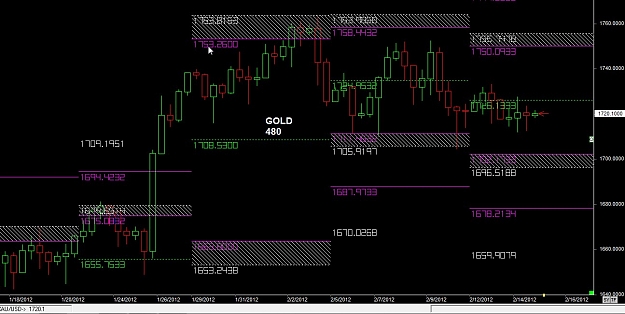
(OLD CHARTS using Dynamic Fib Levels)
Attached Image (click to enlarge)
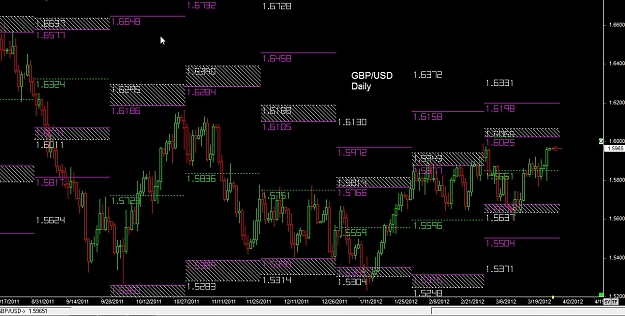
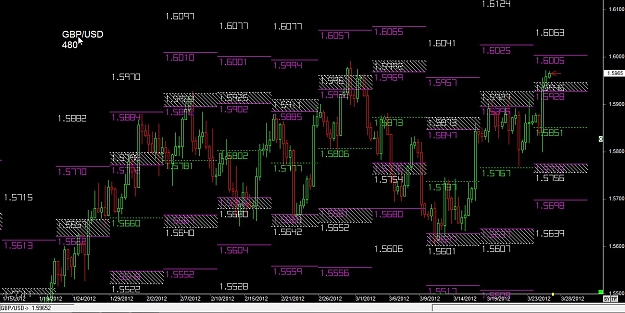
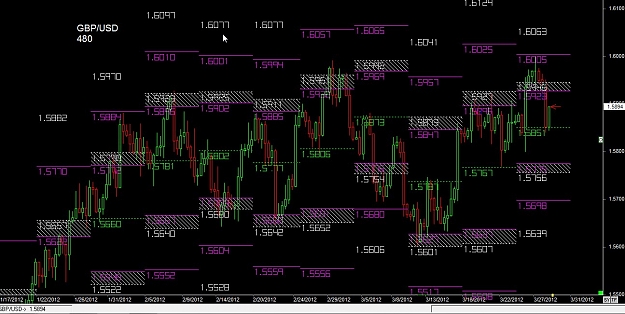
FibZones are calculated from the previous swing. The green dotted line is the 50% midline. Normally, if we get a candle open above the midline we are likely to go up to resistance. Resistance is shown as the shaded resistance zone. Once we hit this target we are likely to see either retracement or consolidation. If it falls short of this area we look back to our midline for support. But if we break above the shaded area and sit on top we look to the purple line as a secondary line of resistance.
Likewise if we break and open below the midline we look to the shaded area of support below. This works the same way going down.
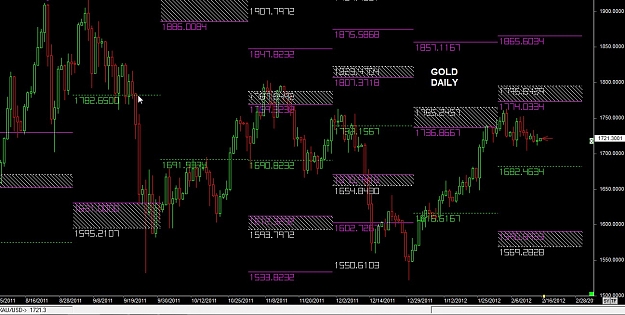
All timeframes work together. We analyze from the large timeframe down to the small because the large timeframe levels are stronger. But price moves from the small timeframe to the large. If you're using Fibzones you start working in one timeframe, the one of your choice. If the move goes passed the shaded area of support or resistance you are still fine. You look to the secondary line of support or resistance located passed the shaded (trouble) area. If the price moves passed the secondary lines then you move with the price action into the next timeframe (using the next FibZones)...then follow the same steps.
(Two old charts using FibZones)
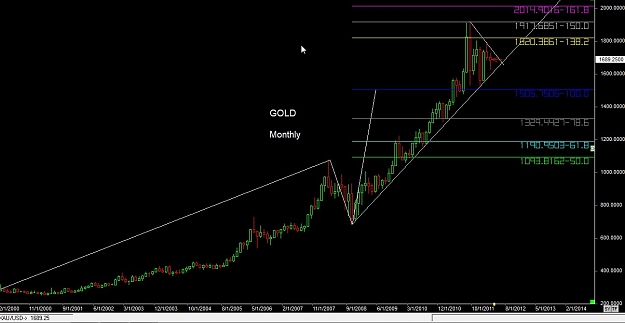
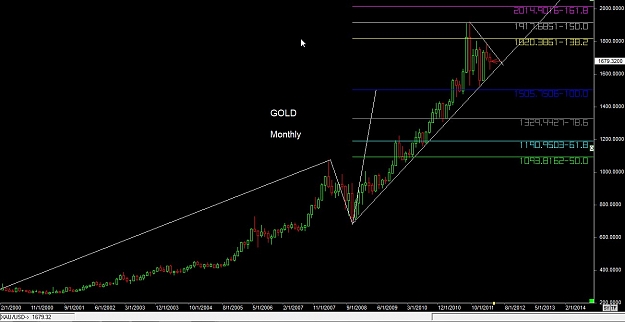
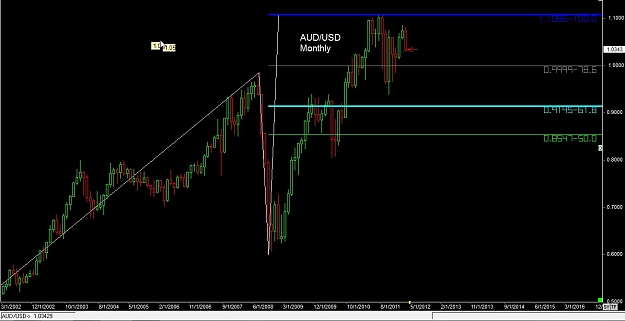
The Monthly chart shows that we have made it to Target 1 (1.1086). After reaching the target we started our retracement toward the 61.8% barrier (.9145), we made it down to .9386.
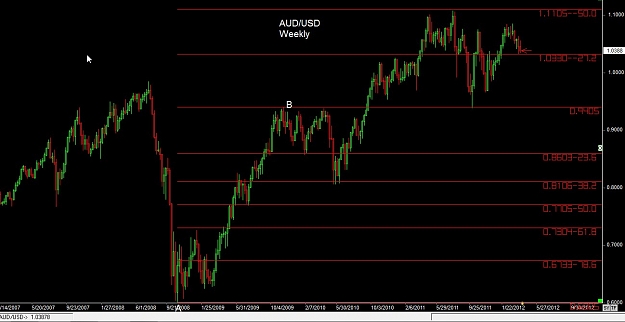
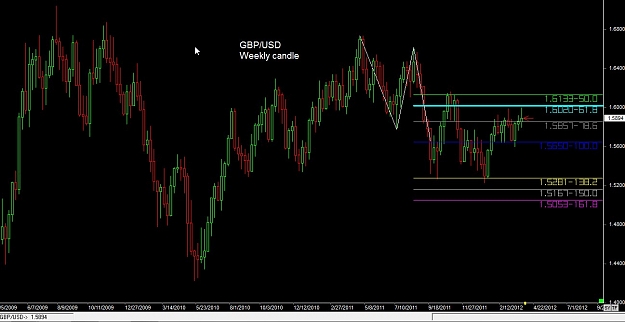
Weekly Candle Chart
Attached Image (click to enlarge)
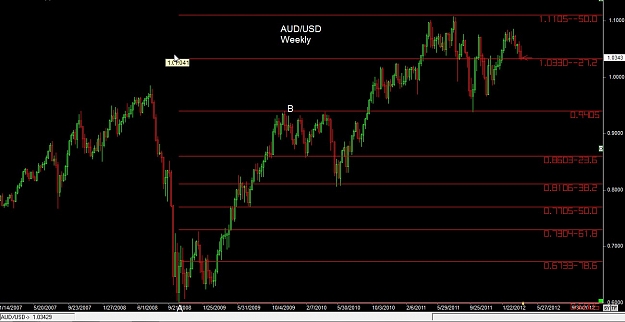
The Weekly chart has a traditional Fibonacci Retracement. Since we retraced to the 38.2% we have a target to the 161.8%/1.1506 (not pictured). So far we made it to the 150% Sub-Target. Like any time we hit a target (especially large targets), expect a retrace. After hitting the 150% Sub-Target we retraced to the "B" (.9405) of the Fibonacci retracement. Then we work in smaller swings and are sitting on top of the 127.2% (1.0330) Sub-Target. The Aussie loves to form Large consolidation in two tiers. In the Weekly chart we want to watch 1.0330. Stay above we go up to the 150% and fall below we look to the "B" (.9405). The Weekly chart has all the numbers in it.
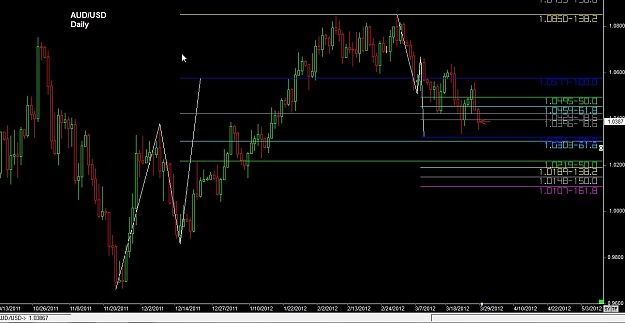
Daily Candle chart
Attached Image (click to enlarge)
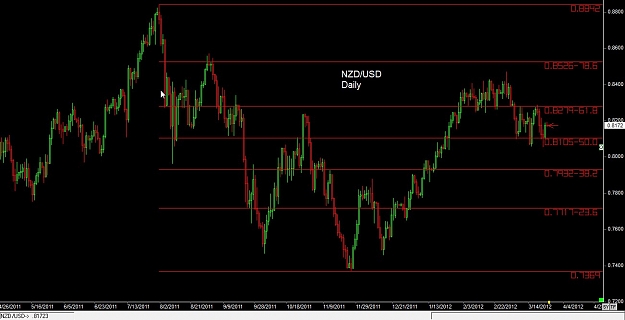
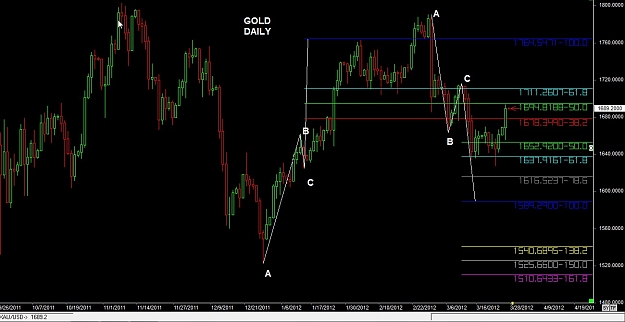
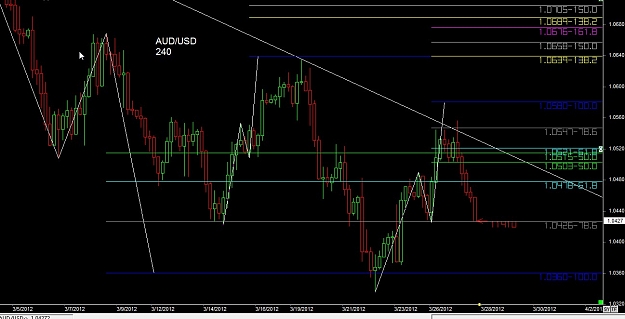
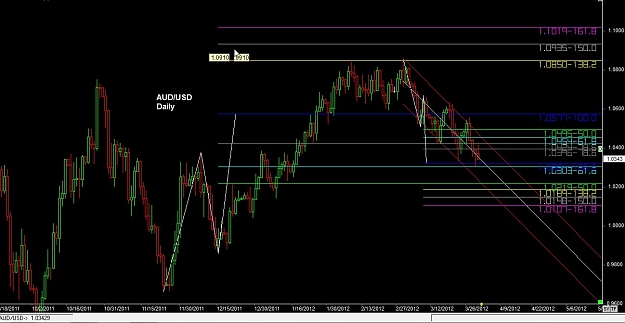
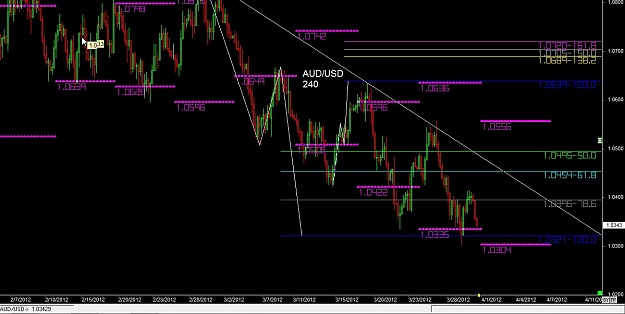
The Daily Candle chart shows a small piece of the larger up move .9665/1.0379/.9860. The price action had made it up to the 138.2% (1.0849) Sub-Target and continued down near the 100% (1.0575) Target 1. Then we took our second attempt at making it above the 138.2. We made it to the Sub-Target again, but failed to get/stay on top. After failing to make it passed the 138.2 we retraced lower than the 100% this time...continuing down passed the 78.6% (1.0422) Sub-Barrier to the 61.8% (1.0302) Main Barrier. We want to keep a good eye on this 1.0302 area. Along with the dynamic fib on the swing up, we show the smaller dynamic fib on the smaller swing down. It has made it to it's 100% (1.0321) Target 1. Swings make up swings to meet swings, which make up swings.
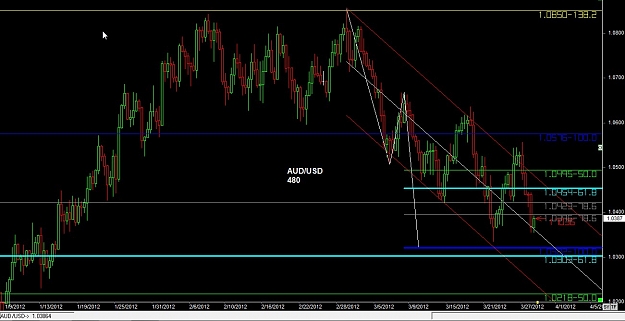
480 Candle chart
Attached Image (click to enlarge)
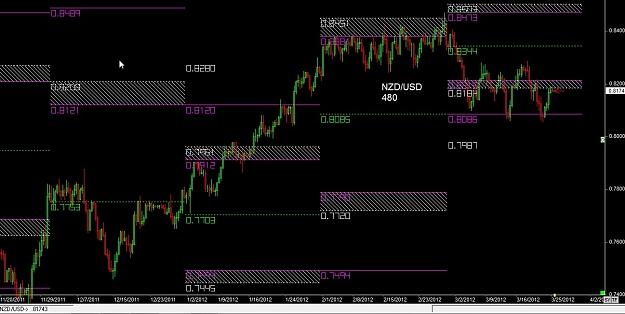
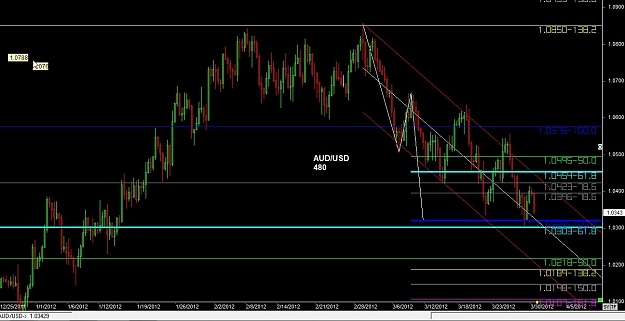
The 480 Candle chart shows you a closer look at the movement described above. You can see a portion of the upswing in the daily, and you get a good look at the smaller down move.
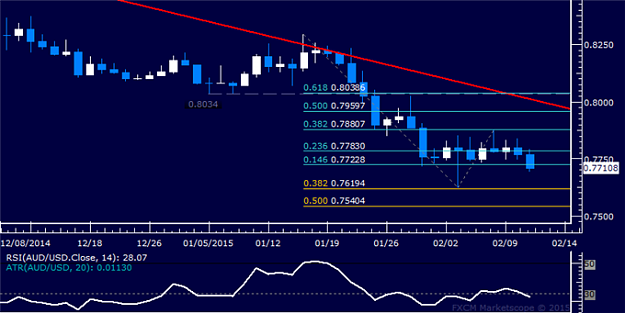
AUD/USD Technical Analysis: Range Breakout Under Way?
The Australian Dollar may be preparing to renew the descent against its US namesake as prices threaten to piece two-week range support. Near-term support is at 0.7723, the 14.6% Fibonacci retracement, with a break below that confirmed on a daily closing basis exposing the 38.2% Fib expansion at 0.7619. Alternatively, a reversal above the 23.6% retracement at 0.7783clears the way for a challenge of the 38.2% expansion at 0.7881.
Attached Image (click to enlarge)
------------------SIGNATURE----------------------- Download over 2900 forex robots and indicators for 100% FREE at:http://mt4talk.com/