For prashant and rest of thread:
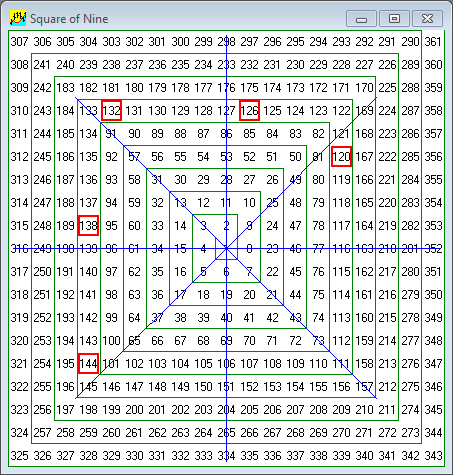
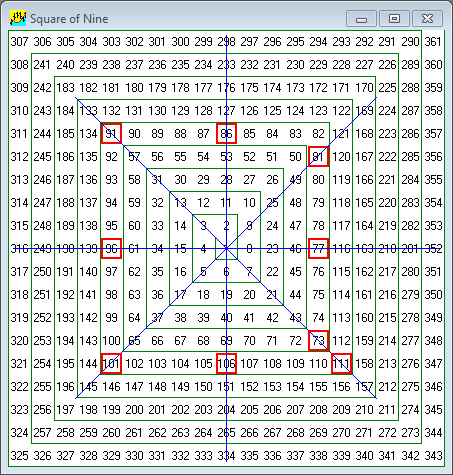
here is a calculation of price to price by 45 degrees to project S/r levels for longer term levels
Attached Image
plotted on chart for convenience..
start of the price calculations are from 1.2600 downtrend low.
Attached Image (click to enlarge)
1.32 is current pivot or handle we can call it thats been holding price.
is it an uptrend or a downtrend currently? thats our job daily to daily basis to do it step by step day to day
hey prash - what cycle are you using to project this and on what timeframe are you viewing it from? Is it a price to price calculation? if it is a time cycle to project highs and lows u cant really define the H/L levels beforehand.
Ignored
Nothing bro just saw some cycle formations on weekly and there i got an idea that
this may start its new leg downside
1.42 to 1.32 & 1.26 to 1.35 then finally 1.35 to 1.25 continuation to 1.22 like that but still have to work on it. wanted to know if any body has this type of view my guess is samadani might have better explanations
Obviously it went to retest Lower TLs, then jumped.
For EU i posted my view early in the morning. Right shoulder is shaping up for Head and shoulders on daily. Thats why EU is retracing. Invalidated intraweek shorts ONLY if EU gets above 3350-75.
Nothing bro just saw some cycle formations on weekly and there i got an idea that
this may start its new leg downside
1.42 to 1.32 & 1.26 to 1.35 then finally 1.35 to 1.25 continuation to 1.22 like that but still have to work on it. wanted to know if any body has this type of view my guess is samadani might have better explanations
Ignored
ah ok
if u have a chart that would really help prash
For prashant and rest of thread:
here is a calculation of price to price by 45 degrees to project S/r levels for longer term levels Attachment
plotted on chart for convenience..
start of the price calculations are from 1.2600 downtrend low. Attachment
1.32 is current pivot or handle we can call it thats been holding price.
is it an uptrend or a downtrend currently? thats our job daily to daily basis to do it step by step day to day
Ignored
I didn't got it
How u calculate it and depends on what?What about other currency like AUD?
I didn't got it
How u calculate it and depends on what?What about other currency like AUD?
Ignored
none taken Phanti
hey phanti no it isnt. its like fibs extensions - they are projected beforehand of price movement, lets say example 1.618 extension of a swing. or even reetracements.. It is usually put on a chart before price actually reaches there right?(the retracements and extensions) same deal, its just a similar use of possilbe s/r levels...
aud levels to those who would care to look at it in a minute
- and eg ill Pm u about it, the spiders den better for analysis and charts and not discussion. only trading discussion maybe but not much on others. as T and BW tries to preseve professionalism we should support a similar cause
aud levels since 0.8100
one always needs onfirmation from PA to suggest support or resistance at these levels.
Attached Image
Attached Image (click to enlarge)
its based on the square of 9. It uses price movement to gauge possible future price movement targets or levels using one point and certain angles for price.
anymore explanation i would write an essay
intraday aud has rejected 1.0700. perhaps a bear trap. stop to BE+1 on long
just wanted to share some thoughts -1.22 is still long way i know
Ignored
Prashant my dear friend...
Here there are 2 traders either the fly or the spider...
I have told you this yet another time..
No Chart ......no posting....
I dont care where the euro will be in 8 months...
Tell me where we are going today tommorow ..with your chart..
An example of swing trades...Learn from the postings of Egkid
Regards
BW
Be sensitive to subtle differences between 'intuition' and 'into wishing.
Prashant my dear friend...
Here there are 2 traders either the fly or the spider...
I have told you this yet another time..
No Chart ......no posting....
I dont care where the euro will be in 8 months...
Tell me where we are going today tommorow ..with your chart..
An example of swing trades...Learn from the postings of Egkid
Regards
BW
Ignored
thanks for reminding me . was still working on the charts
none taken Phanti
hey phanti no it isnt. its like fibs extensions - they are projected beforehand of price movement, lets say example 1.618 extension of a swing. or even reetracements.. It is usually put on a chart before price actually reaches there right?(the retracements and extensions) same deal, its just a similar use of possilbe s/r levels...
aud levels to those who would care to look at it in a minute
- and eg ill Pm u about it, the spiders den better for analysis and charts and not discussion. only trading discussion maybe but not...