• Home
  • Forums
  • Trades
  • News
  • Calendar
  • Market
  • Brokers
  • Login
  • Join
  • User/Email: Password:
  • 11:42pm
Menu
  • Forums
  • Trades
  • News
  • Calendar
  • Market
  • Brokers
  • Login
  • Join
  • 11:42pm
Sister Sites
  • Metals Mine
  • Energy EXCH
  • Crypto Craft

Options

Bookmark Thread

First Page First Unread Last Page Last Post

Printable Version

Similar Threads

How to Blow $200 account using VSA--- 579 replies

VSA Journal 57 replies

VSA-divergence trading 186 replies

VSA broker history change datas 11 replies

  • Interactive Trading
  • /
  • Reply to Thread
  • Subscribe
  • 10,941
Attachments: vsa with Malcolm
Exit Attachments

vsa with Malcolm

  • Last Post
  •  
  • 1 11391140Page 114111421143 1687
  • 1 Page 1141 1687
  •  
  • Post #22,801
  • Quote
  • Feb 24, 2012 6:09am Feb 24, 2012 6:09am
  •  calnago
  • | Joined Feb 2012 | Status: Member | 4 Posts
http://savepic.su/1423064m.gif
  • Post #22,802
  • Quote
  • Feb 24, 2012 6:09am Feb 24, 2012 6:09am
  •  gez40
  • | Joined May 2009 | Status: Member | 557 Posts
Could any Tradeguider users please tell me how reliable it is at picking up strength and weakness, been looking at a lot of charts recently and there are clear upthrusts and no demands which the software has not picked up, presumably these would not be picked up on the scan either.

Gez.
Seek not to change the world; seek only to change your mind about the world
  • Post #22,803
  • Quote
  • Feb 24, 2012 6:16am Feb 24, 2012 6:16am
  •  foxybunny
  • | Joined Nov 2007 | Status: Member | 1,157 Posts
Quoting gez40
Disliked
Some nice explanations here on springs.

http://stockcharts.com/school/doku.p...lysis:wyckoff2
Ignored

gez40, thanks, good explanation there.

Like you, I also looking for Wyckoff materials around FF.

I read the Hank Pruden's MTWyckoffSchematics.pdf that provided by Ady and that pdf is good.

Did u have time to read Juhanimi posted a website for you?
That websit any good or not ?

For Point&Figure charts as target, guess it meant Wyckoff is basically looking at previous major support and resistance as targets, perhaps less people are using this Point&Figure as a tool, not a common chart feature on MT4.
  • Post #22,804
  • Quote
  • Feb 24, 2012 6:18am Feb 24, 2012 6:18am
  •  foxybunny
  • | Joined Nov 2007 | Status: Member | 1,157 Posts
Quoting gez40
Disliked
Could any Tradeguider users please tell me how reliable it is at picking up strength and weakness, been looking at a lot of charts recently and there are clear upthrusts and no demands which the software has not picked up, presumably these would not be picked up on the scan either.

Gez.
Ignored

Perhaps you can show charts of where you saw clear upthrusts and no demands showing volume, but Tradeguider did not show ??
  • Post #22,805
  • Quote
  • Feb 24, 2012 6:30am Feb 24, 2012 6:30am
  •  gez40
  • | Joined May 2009 | Status: Member | 557 Posts
Quoting foxybunny
Disliked
Perhaps you can show charts of where you saw clear upthrusts and no demands showing volume, but Tradeguider did not show ??
Ignored
Let me dig around, think i saw them on the vsa club forum.
Seek not to change the world; seek only to change your mind about the world
  • Post #22,806
  • Quote
  • Feb 24, 2012 8:59am Feb 24, 2012 8:59am
  •  ady_babe
  • | Joined May 2011 | Status: mamba | 282 Posts
Quoting foxybunny
Disliked
Thanks Ady for your explanation.

The "Spring" in Wyckoff would be similar to a "Shake Out" or "Test" in Williams.

Now understood your meaning of what is a "SpringBoard" as opposed to a "Spring".

In the SpringBoard area, I was expecting another Spring or SecondaryTest to signal price may go up like mentioned in the Wyckoff's Schmatic, but could see this hint in this SpringBoard area.

You said the in the SpringBoard, the closes seem be in the middle of the range giving hint of re-accumulation. What would give hint of distribution...
Ignored
Thankyou for your explanations, appreciate it- I am not that familiar with Gavins Tradeguider- it looks confusing, so cant comment.

In a springboard we get the gradual removal of the bears- every time they enter at the top of the range they are not given much room and price is quickly moved up (angle of ascent), so with less and less bears jumping in there is no need to test, just move price away, with little volume on the bullish side the composite operators can see movement- Effort Vs Results.

Accumulation and Distribution have many guises that's for sure. So ya when I spot them I will post them for sure. What initially started this move the spring on the 16th was basically a day of re-accumulation as prices were moved down. Looking at this day on a 10min chart will give you some clues of one type of Re-accumulation. It is supposed to be very hard to spot, we are dealing with professionals. Distribution usually takes place as we move up (in strength- which Im sure you know) and takes place over time- I like to look for good news!

POF charting is EASY.

http://www.dukascopy.com/plugins/fxMarketWatch/

will give you accurate POF charts. I also use FIBS. The target was set by the range on the week of the 27th Jan through 16th Feb this was a major area of accumulation. Have enclosed a 5min read about them. As the focus here is VSA wont get to involved with POF but there is plenty of material out there.

Also enclosed a Wyckoff dictionary at least we are then on the same page. The dict is weak but stands up ok.
Attached Files
File Type: pdf FOREX - Point and Figure Charts (TAS&C).pdf   182 KB | 668 downloads
File Type: pdf Wyckoff-Terms-and-Their-Definitions.pdf   48 KB | 6,226 downloads
  • Post #22,807
  • Quote
  • Feb 24, 2012 9:21am Feb 24, 2012 9:21am
  •  KinsaleForex
  • Joined Oct 2010 | Status: Looking at a few more charts... | 1,195 Posts
Quoting ady_babe
Disliked
Thankyou for your explanations, appreciate it- I am not that familiar with Gavins Tradeguider- it looks confusing, so cant comment.

In a springboard we get the gradual removal of the bears- every time they enter at the top of the range they are not given much room and price is quickly moved up (angle of ascent), so with less and less bears jumping in there is no need to test, just move price away, with little volume on the bullish side the composite operators can see movement- Effort Vs Results.

Accumulation and Distribution have many guises...
Ignored
Odd box sizes on that pnf link. 12x3? No way to change it from what I can see either..
  • Post #22,808
  • Quote
  • Feb 24, 2012 9:23am Feb 24, 2012 9:23am
  •  pres78
  • Joined Sep 2010 | Status: I'm not here... or am I? | 3,951 Posts
Quoting KinsaleForex
Disliked
Odd box sizes on that pnf link. 12x3? No way to change it from what I can see either..
Ignored
Change the TF
Today's zone = Tomorrow's opportunity!
  • Post #22,809
  • Quote
  • Feb 24, 2012 9:51am Feb 24, 2012 9:51am
  •  KinsaleForex
  • Joined Oct 2010 | Status: Looking at a few more charts... | 1,195 Posts
Quoting pres78
Disliked
Change the TF
Ignored
Yeah I realise that, but it's the box size (amount of pips per X or O) that I want to change. It's set to 12 pips, ideally i'd like 10.
  • Post #22,810
  • Quote
  • Feb 24, 2012 1:36pm Feb 24, 2012 1:36pm
  •  Momomoney
  • | Joined Jun 2010 | Status: 72 yr old Rookie Forex Trader | 79 Posts
Quoting KinsaleForex
Disliked
Yeah I realise that, but it's the box size (amount of pips per X or O) that I want to change. It's set to 12 pips, ideally i'd like 10.
Ignored
Please be advised that if your broker offers 5 decimal pricing, then you will likely need to set that box size to 120, not 12. Setting that box size to 12 only will count the fifth digit and give you inaccurate point & figure chart as it looks at the fifth digit. Keep in mind, with 5 decimal pricing 200 Pips actually appear as 2000 points. Therefore, a 10 pip box-size is set to 100 and 12 pip box-size would be set to 120.

Just my humble opinion. Thank you.
  • Post #22,811
  • Quote
  • Feb 24, 2012 1:43pm Feb 24, 2012 1:43pm
  •  ady_babe
  • | Joined May 2011 | Status: mamba | 282 Posts
Quoting Momomoney
Disliked
Please be advised that if your broker offers 5 decimal pricing, then you will likely need to set that box size to 120, not 12. Setting that box size to 12 only will count the fifth digit and give you inaccurate point & figure chart as it looks at the fifth digit. Keep in mind, with 5 decimal pricing 200 Pips actually appear as 2000 points. Therefore, a 10 pip box-size is set to 100 and 12 pip box-size would be set to 120.

Just my humble opinion. Thank you.
Ignored
brilliant
  • Post #22,812
  • Quote
  • Feb 24, 2012 5:52pm Feb 24, 2012 5:52pm
  •  KinsaleForex
  • Joined Oct 2010 | Status: Looking at a few more charts... | 1,195 Posts
Quoting Momomoney
Disliked
Please be advised that if your broker offers 5 decimal pricing, then you will likely need to set that box size to 120, not 12. Setting that box size to 12 only will count the fifth digit and give you inaccurate point & figure chart as it looks at the fifth digit. Keep in mind, with 5 decimal pricing 200 Pips actually appear as 2000 points. Therefore, a 10 pip box-size is set to 100 and 12 pip box-size would be set to 120.

Just my humble opinion. Thank you.
Ignored
Thanks for the tip, well aware of this thanks!

I've actually stopped using PnF in my analysis. It pains me to even think about it so i'm not going to get into it now. The amount of software programs that don't implement it correctly is simply astounding. And any emails I send or comments I raise seems to fall on deaf ears.

I used to do it by hand and If i was to reintroduce PnF to my analysis, this is the only way I would do it.

I'm angry just thinking about it
  • Post #22,813
  • Quote
  • Feb 25, 2012 12:36pm Feb 25, 2012 12:36pm
  •  ady_babe
  • | Joined May 2011 | Status: mamba | 282 Posts
This is a post I put on the VSA forum (contact Liam FF:KinsaleForex) It is a great place to meet VSA GURU's from which I am learning.

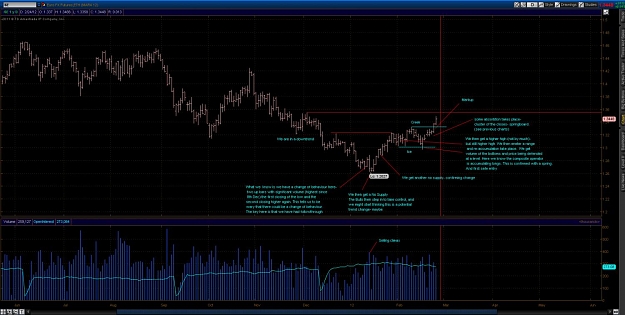
We know we have had a possible change of behavior at 1.264. We have had high volume on bars closing of the lows and toward the top. At this stage we don't know how this will effect the market. What we know is that down trends change under two senarios: a selling climax and lack of supply. But we need Demand to enter else there will be no change. We need confirmation of this demand (a way of checking that our demand is the right thing for the market) and we get a No Supply at the low. The composite operator recognizes these signs and marks price up, we then get another NS to further confirm possible Trend change. We then enter a range. It is here that for me safe entries come about. As the range progresses we see volume coming in at the bottom, angle of ascent, basically price being defended from the bottom of the range. We then get markup and a fall back into the range and a spring (shakeout), this for me is the perfect entry. (1.29955) We now we are in an uptrend. We see accumulation. If the composite operator is buying we know that higher prices are due. They have not spent Millions (billions) for price to only move 50pips- they want a return. I personally hold and just follow the tactics of the composite operator- accumulate when the do.

So we also know that its time for us to buy in safe places. We need to figure out at what places the composite operator is buying also, and thus will defend these levels.

We also know that price will be marked up and then return to a level in which there is demand for it. The ebb and flow of the market. recognizing these levels gives us future trade opportunities, and chances to add to our positions.

I have a target of 1.354 (close to Jason's target). And it is here I would expect to see our first significant change in behavior and enter a range again to build cause for another move.

Of course anything can happen... and the unexpected is also expected.
Attached Image (click to enlarge)
Click to Enlarge

Name: 2012-02-25_0931.jpg
Size: 138 KB
  • Post #22,814
  • Quote
  • Feb 25, 2012 3:17pm Feb 25, 2012 3:17pm
  •  gozila
  • | Joined Nov 2010 | Status: Member | 15 Posts
hi everybody

anybody know what is the difference between

1 climax action

2-climactic action

3-push thru S/D effort
  • Post #22,815
  • Quote
  • Feb 26, 2012 9:28am Feb 26, 2012 9:28am
  •  BeLikeWater
  • | Commercial Member | Joined Jan 2010 | 600 Posts
Quoting gozila
Disliked
hi everybody

anybody know what is the difference between

1 climax action

2-climactic action

3-push thru S/D effort
Ignored
1 & 2 are the same. And indicates a possible change in trend.

3.- Its pushing old highs/lows with effort of volume that normally means price could rally after that.
Greetings, BeLikewater
  • Post #22,816
  • Quote
  • Edited at 10:30am Feb 26, 2012 9:33am | Edited at 10:30am
  •  ady_babe
  • | Joined May 2011 | Status: mamba | 282 Posts
Quoting gozila
Disliked
hi everybody

anybody know what is the difference between

1 climax action

2-climactic action

3-push thru S/D effort
Ignored
Hi Gozila,

18 hours and no one has answered- terrible- OK Read Master the Markets (perhaps again?).

Here is the link: http://www.4shared.com/office/DlGrcm..._Tom_Will.html

Page 81 for selling Climax
Page 83 for Buying climax
Page 65 Pushing through Supply/Support Zones

After you have done this perhaps you can tell us the answers to you questions. Looking forward to it. I am a believer in going to the original source first and then.... asking how different traders interpret the answers to your own questions.
  • Post #22,817
  • Quote
  • Edited at 9:51am Feb 26, 2012 9:34am | Edited at 9:51am
  •  ady_babe
  • | Joined May 2011 | Status: mamba | 282 Posts
A man found a cocoon of an emperor moth.
He took it home so that he could watch the moth come out of the cocoon.
On the day a small opening appeared, he sat and watched the moth for several hours as the moth struggled to force the body through that little hole.

Then it seemed to stop making any progress.
It appeared as if it had gotten as far as it could and it could go no farther.
It just seemed to be stuck.
Then the man, in his kindness, decided to help the moth, so he took a pair of scissors and snipped off the remaining bit of the cocoon.
The moth then emerged easily.

But it had a swollen body and small, shriveled wings.
The man continued to watch the moth because he expected that, at any moment, the wings would enlarge and expand to be able to support the body, which would contract in time.

Neither happened!
In fact, the little moth spent the rest of its life crawling around with a swollen body and shriveled wings. It never was able to fly.

What the man in his kindness and haste did not understand was that the restricting cocoon and the struggle required for the moth to get through the tiny opening was the way of forcing fluid from the body of the moth into its wings so that it would be ready for flight once it achieved its freedom from the cocoon.

Freedom and flight would only come after the struggle.
By depriving the moth of a struggle, he deprived the moth of health.

Sometimes struggles are exactly what we need in our life.
If we were to go through our life without any obstacles,
we would be crippled.
  • Post #22,818
  • Quote
  • Feb 26, 2012 2:04pm Feb 26, 2012 2:04pm
  •  Shaggy_rock
  • | Joined May 2010 | Status: No you don't. | 281 Posts
Well said, struggle to survive ... this goes for everything in life.
A lesson lived is a lesson learned. Take care,
Old Habits Die Hard.
  • Post #22,819
  • Quote
  • Feb 26, 2012 5:30pm Feb 26, 2012 5:30pm
  •  pres78
  • Joined Sep 2010 | Status: I'm not here... or am I? | 3,951 Posts
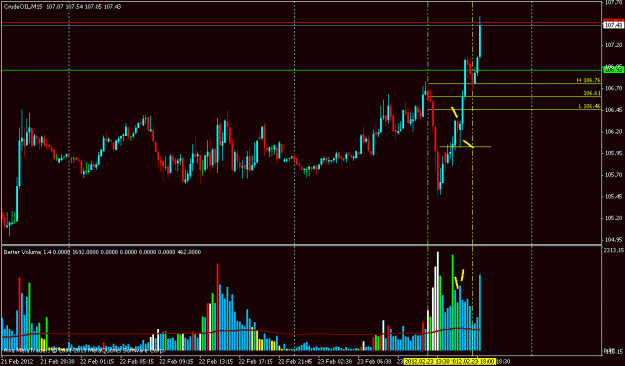
Haven't posted here much lately and don't remember the last chart I posted so here are 2...

The first is Feb 23rd.

I fib zone I left on is to show the highest climatic action (at the time) which caused a bit of a trend change on the day. This occured and was followed by a sell off. Now I am focusing only on the 15min charts for this exercise as this is where I pull my UHV zones from and take entries either on the 15 or mainly the 5min. Now on this chart I have left off the lowest fib zone which is from the selling climax / stopping volume right at the daily low for clarity and leave the focus on that UHV at the time zone (which obviously is no wheres near the highest volume anymore) as it ends up proving important yet again later in the day.

so I have marked the high of that highest volume with a short yellow line and as you will see the second highest volume bar of the day occured as we finally pushed back out of and closed above the high of the low control bar. Look at all that lower wick and effort to push up and out... as you will see there is also some upper wick showing the supply that was still present. The we get a nice push up and then a NS... would I have entered on this NS? No I would not... why? Even though there was now strength behind us and the controlling volume below us we are right below another volume control zone that has affected price already once today, there is no way that I am going to buy right into the low of this zone. Then the very next bar we get another SOS with a SO bar (I suppose the long lower wick running back down to the high of that UHV bar is a bit of a spring and BUEC ?) ... still for me buying right into the low of this upper zone and so close to the days high is just too risky... so we wait.

Then we see that the lack of supply and the now obvious strength in that SO we easily push up and through that upper zone on 2 WRB's. Now here is where patience is truly key... we don't want to panic and chase a potentially lost trade... don't be part of the herd. If the breakout we genuine we will see a test and this is where I will (and did) enter.

Classic 3 bar retrace (another back up to the creek for the Wyckoffers... I know it's not the right use but hey I tried )... back to the high of that upper zone on a complete drop off in volume (lowest in like 20 bars) close on the high with a nice lower test tail dipping into the zone)... perfect.

And now the 24th...

Quite similar... we get a cliamax bar (SO) but see that there is still supply present in the market. Now I am think if we get below short / get above long. Let's look at how the next bars played out...

We dip below the low on NBP and then see the next upbar is squat on increased volume. Now I prefer to trade the lack of volume bars rather than the higher volume bars but I note this as a SOW. Then we get a reverse UT / SO bar making the lowest low of the day closing closer to it's high on increased volume., ND and then a push back up into the zone. Next bar is an increased volume downbar closing on the low fib... SOS.

We get a move back up to the high and then an increased volume push up and out. Here is where we need to recognize that we have SOS in the background and we are above the controlling volume so we need to see that that UT while showing some weakness is not a weak bar... UT's in a strong market are like a ND in a strong market... they need to be noted but without further confirmation they really are out of place... similar to what we saw on the 23rd we are simply seeing the effect of the push up though and the reminents of the remaining supply.

ND UT... SM are not active and really are just allowing the market to probe up a bit. The we get out entry (again I took this) we see the market marked down into the control zone high on NS (lowest volume in 17 bars) to test it... SM signal that they aren't going back down and up we go.
Attached Images (click to enlarge)
Click to Enlarge

Name: oil%202_23_2012.gif
Size: 21 KB Click to Enlarge

Name: crude%202_24_2012.gif
Size: 20 KB
Today's zone = Tomorrow's opportunity!
  • Post #22,820
  • Quote
  • Feb 26, 2012 7:49pm Feb 26, 2012 7:49pm
  •  ady_babe
  • | Joined May 2011 | Status: mamba | 282 Posts
Brilliant post Prez! You read charts so well. We need a like button.

Enjoyed the Wyckoffian mention... the dark side awaits one of its own!
  • Interactive Trading
  • /
  • vsa with Malcolm
  • Reply to Thread
    • 1 11391140Page 114111421143 1687
    • 1 Page 1141 1687
0 traders viewing now
  • More
Top of Page
  • Facebook
  • Twitter
About FF
  • Mission
  • Products
  • User Guide
  • Media Kit
  • Blog
  • Contact
FF Products
  • Forums
  • Trades
  • Calendar
  • News
  • Market
  • Brokers
  • Trade Explorer
FF Website
  • Homepage
  • Search
  • Members
  • Report a Bug
Follow FF
  • Facebook
  • Twitter

FF Sister Sites:

  • Metals Mine
  • Energy EXCH
  • Crypto Craft

Forex Factory® is a brand of Fair Economy, Inc.

Terms of Service / ©2021