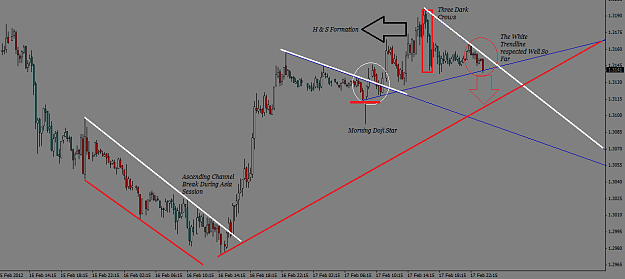
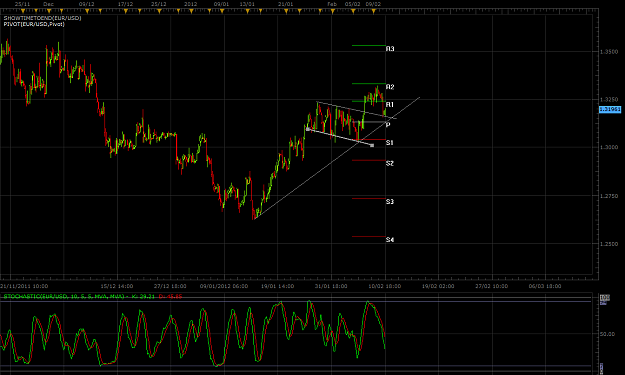
if we break back above 1.3214-21 then i would not be shorting anymore... we dropped down to test the h4 bull breakout imo... my system has partly confirmed resumption of upmove:
This is why this is a good idea to exchange chart ideas patterns etc where others have there trendlines on there charts. Very important.
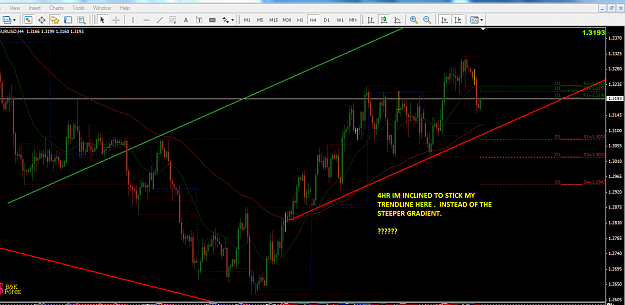
Your trendline is at a far steeper gradient which in affect will be broken easier eventually.
Ignored
perhaps but the chart attached below didn't do that until over 1000 pips were cleared... we've dropped 2300 pips since the top... expecting higher... also your TF is 15mins... if you calculated your broken wedge, it would take us to 1.3031 roughly... that would break the h4 TL... and we all know that TL/patterns on bigger TF are stronger than small TF...
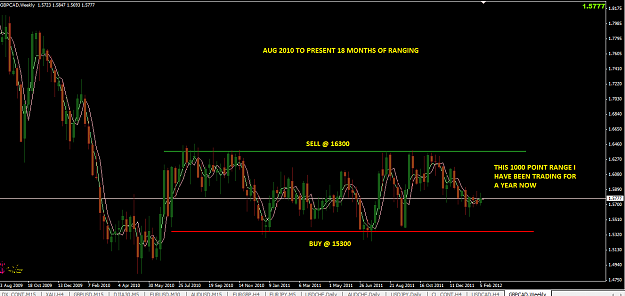
I would like to start a Diary of Charts here as you spot them during the trading day. If we keep these charts to 15 min and above that would be best.
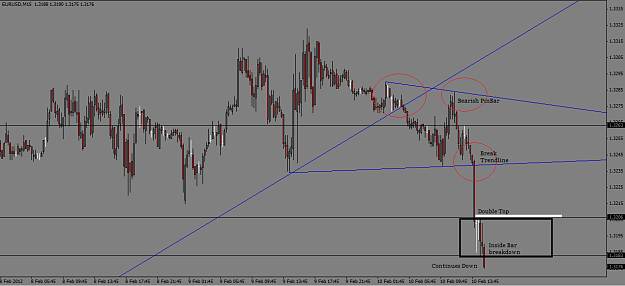
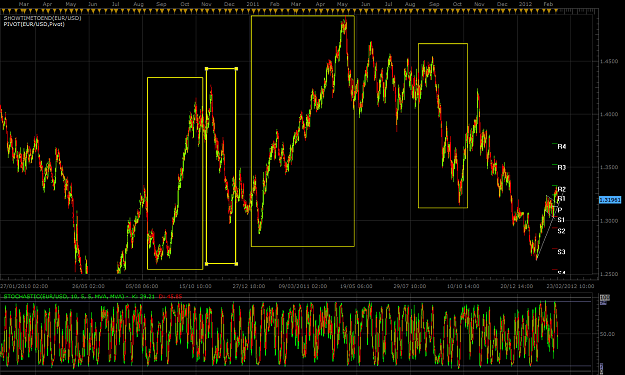
For Example last weeks EURUSD Rising Wedge.
Ignored
Congrats for starting the New Thread, Sis
I like your IDEA opened Chart Patterns, Ranges & Trends Thread.
I hope can HELP Newbies or Experienced Traders to learn about Chart Patterns & find Trends from this Thread.
I really appreciate if Senior Traders will Sharing for it
All the BEST
Always looking the GREAT, never left GOOD Point...
It shows the 'BEAR Flag" that is fairly easy to spot and trade. I put the parameters in the pic to show how a target is measured. It amounts to measuring the pole and then subtracting that from the breakout point.
Also, what should be required when trading this, or any pattern for that matter, is supporting indicators. Note the two indicators below the chart. They support the drop in price coming up.
I've been a pattern trader for years and I like to keep everything as simple as possible.
It shows the 'BEAR Flag" that is fairly easy to spot and trade. I put the parameters in the pic to show how a target is measured. It amounts to measuring the pole and then subtracting that from the breakout point.
Also, what should be required when trading this, or any pattern for that matter, is supporting indicators. Note the two indicators below the chart. They support...
Ignored
I think you cant connected 2 candle on 15 TF become a flag
Btw GL
Attached Image (click to enlarge)
If there was easy money lying around,no one would be forcing it into your
Sure you can. that's what makes chart patterns an art and not a science. There are no hard and fast rules on the size of a flag.
What actually happened is that the downward move of the pole took a break and retraced a bit. It does not have to be a lot, just enough to give the Bear Flag Pole a bottom. The bottom of the pole is the Breakout point. So, if you measure the pole you will have an "Estimate" the move down from the break out to the down side.