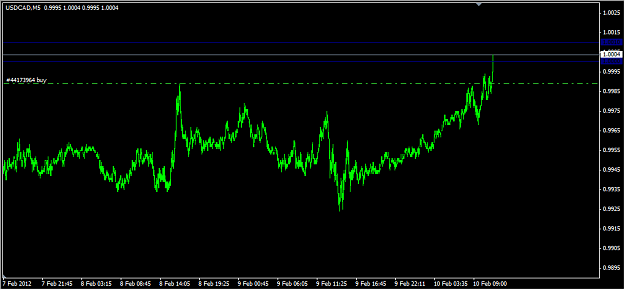
we have to be careful because we are still trading within an ascending symetrical triangle. If we break 1.324 area then we go down, above 1.3285 further up...
will try to post chart
Ignored
Yes most of us play that BUT no decision till now it keep ranging Tight
looks like will turn off the pc and go doing something better
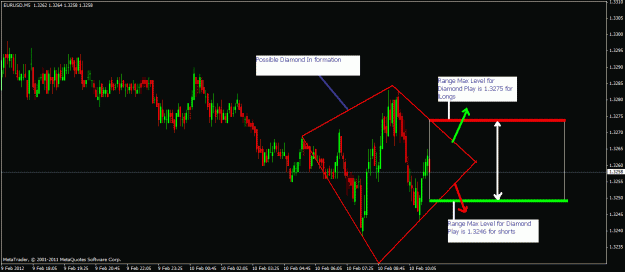
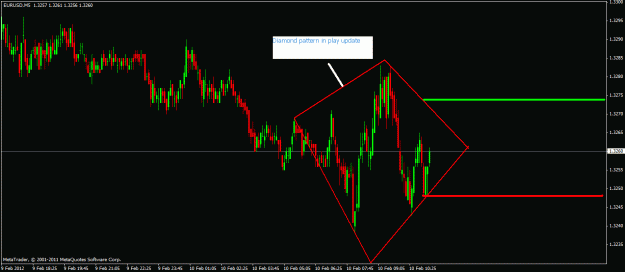
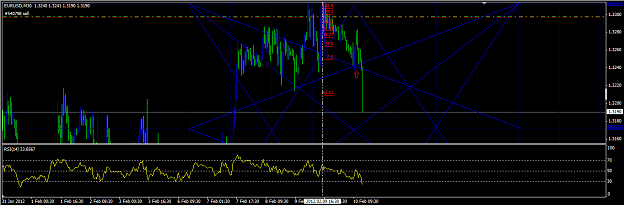
I can See a diamond pattern on euro
Everything explained in the chart:
Currently we have a range ie from 1.3246 -1.3275
As you can see the trendline drawn from the bottom was without any other patterns but the diamond can work well to find max upper limits and lower limits...
Also How do you know this is happening it is called screen time...the more you see your charts the more you see the patterns...
Hope this helps
Regards
BW
Attached Image(s) (click to enlarge)
Be sensitive to subtle differences between 'intuition' and 'into wishing.
I can See a diamond pattern on euro
Everything explained in the chart:
Currently we have a range ie from 1.3246 -1.3275
As you can see the trendline drawn from the bottom was without any other patterns but the diamond can work well to find max upper limits and lower limits...
Also How do you know this is happening it is called screen time...the more you see your charts the more you see the patterns...
Hope this helps
Regards
BW
Ignored
Interesting observation, havent seen diamond pattern for a long time.
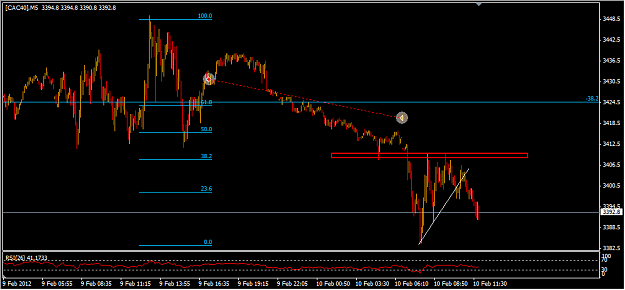
oh no no .. its mt4 standard . no ea. u can drag ur closed orders onto ur screen...
i didnt put up the latest one butu can drag it from ur acc history to ur chart and u can see where ti is closed and all.. helps me keep in track on what i did in the day.
the red one indicated a short order - adn the yellow indicated the closing of it. a short i held from yesterday. decided to close it around frankie open.
u can do that with ur closd orders too... just drag em to ur chart tata
Ignored
Nice Didnt know that. Thanx for the info. Is there a way to change the color of those arrows?
And am I glad I closed all my longs )) between yesterday and this morning!!
I still have my S from 1.3275 but closed the 1.3265 too early..
Let see how it develops. I want to see 1.3135 now and I'll take it from there.
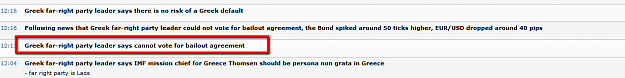
That's not the end of the Greek bailout. They need it so whatever the far right politician says for the fame, they'll be forced to a deal or there will be civil war in Greece