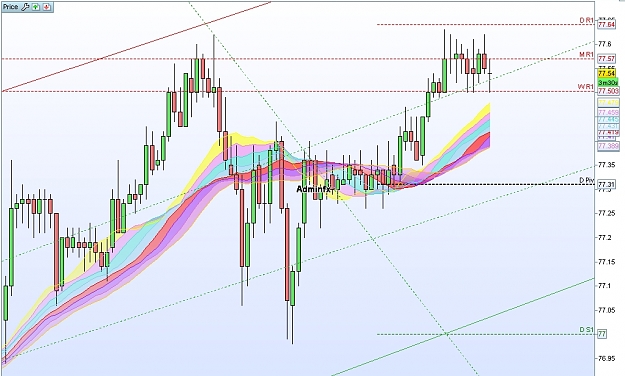
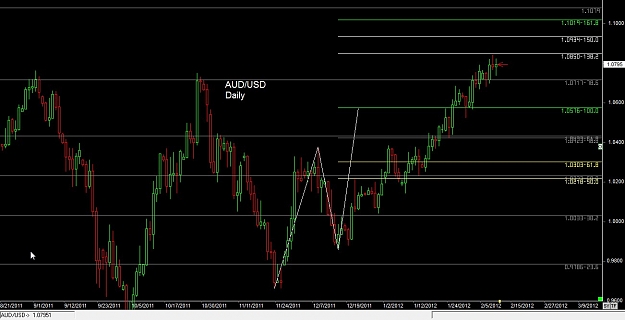
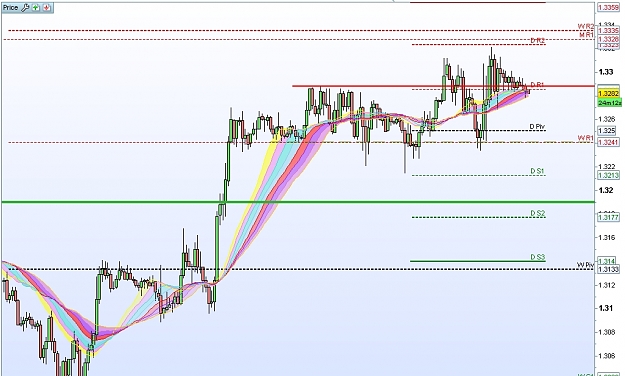
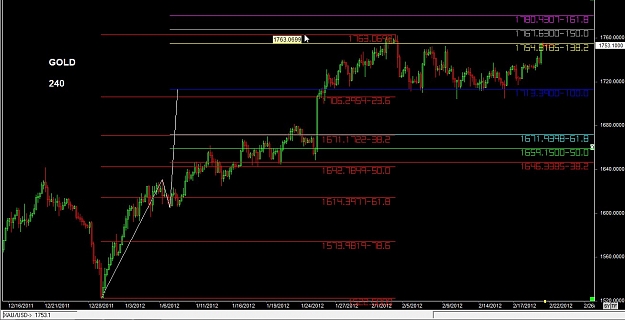
pivot points
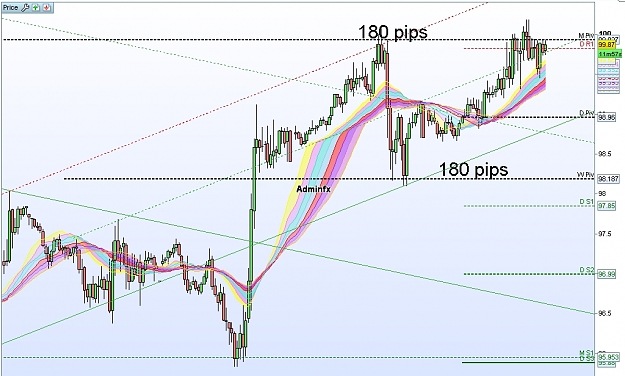
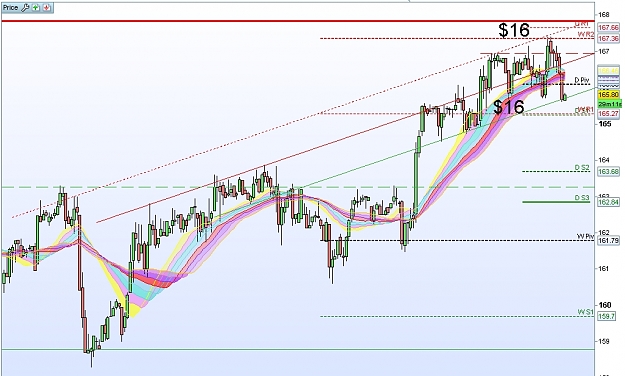
AUD/JPY
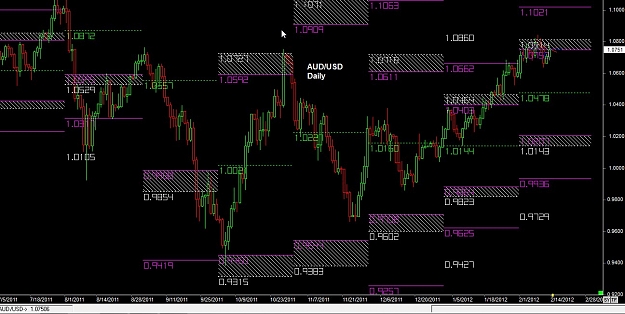
Attached Image (click to enlarge) 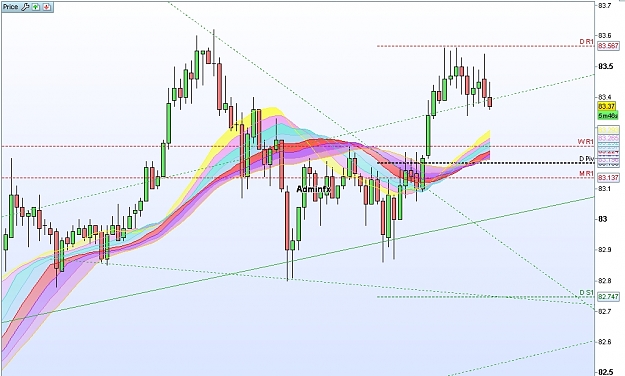
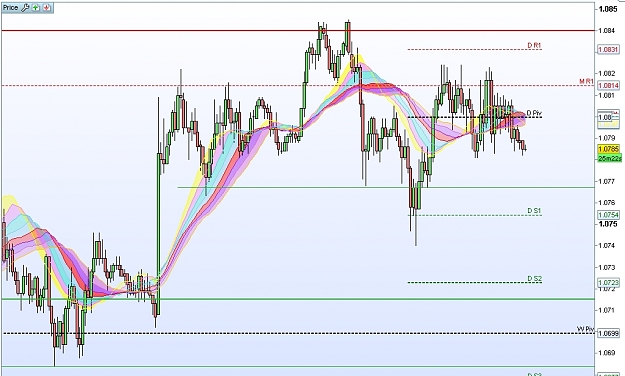
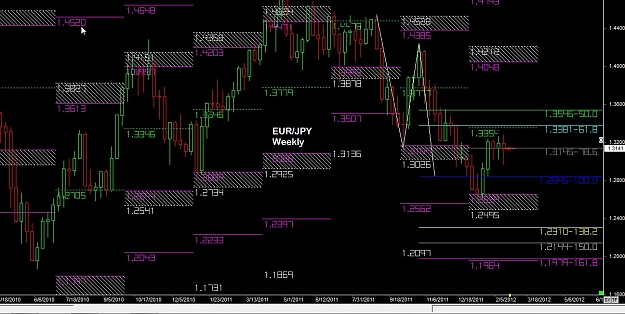
EUR/JPY
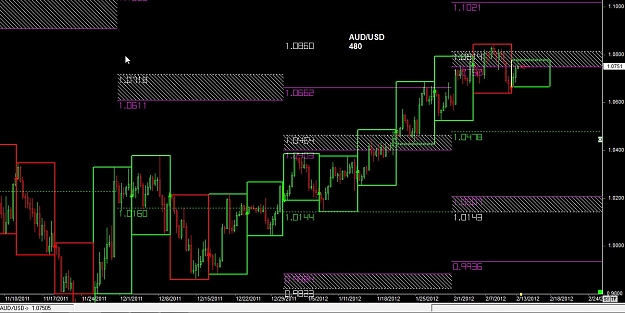
Attached Image (click to enlarge) 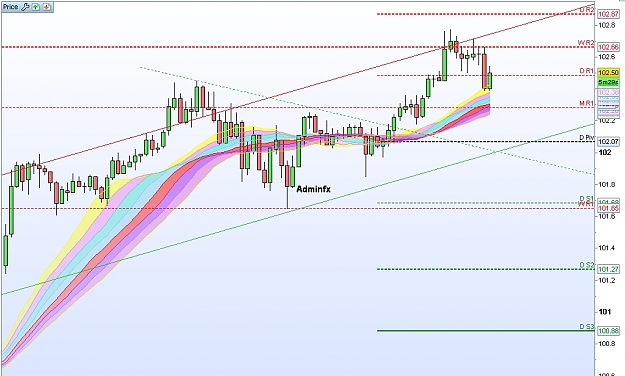
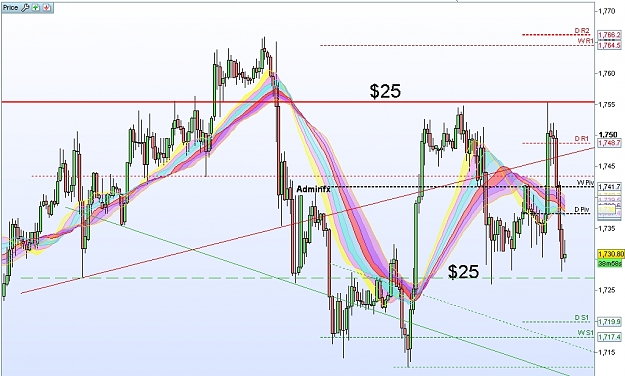
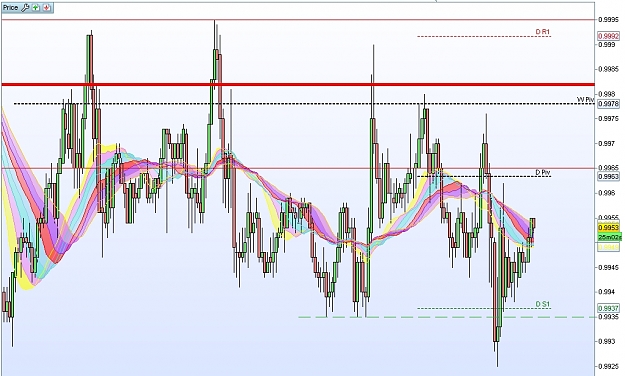
GBP/JPY
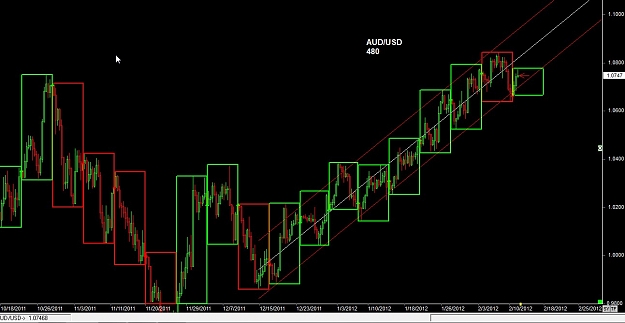
Attached Image (click to enlarge) 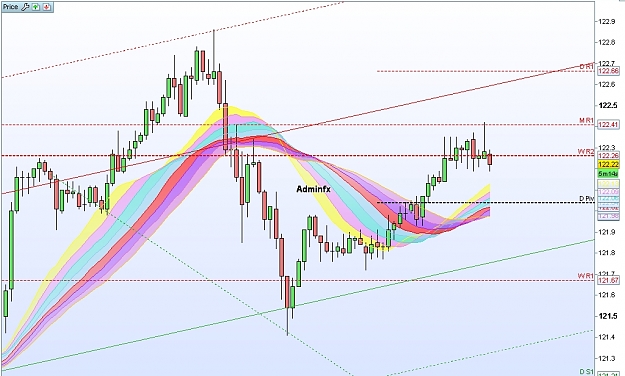
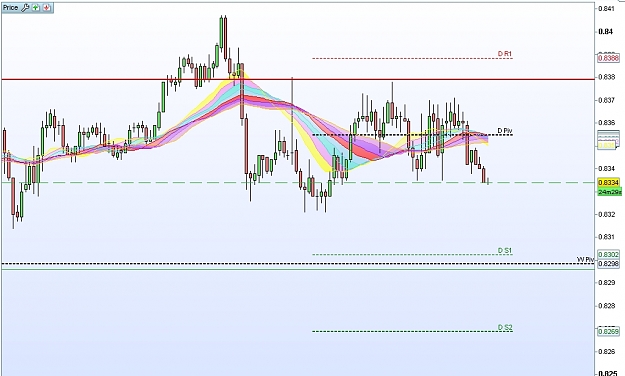
NZD/JPY
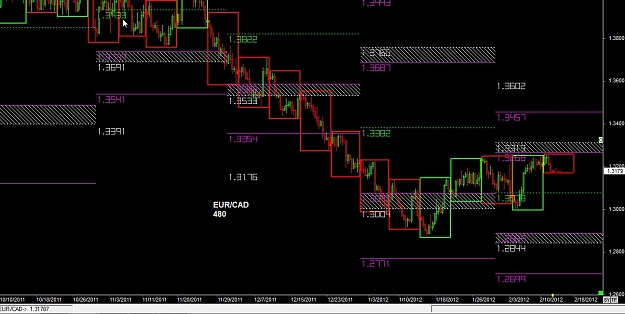
Attached Image (click to enlarge) 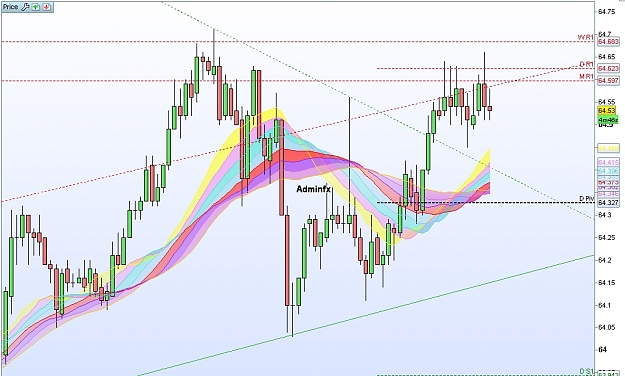
USD/JPY
Attached Image (click to enlarge) 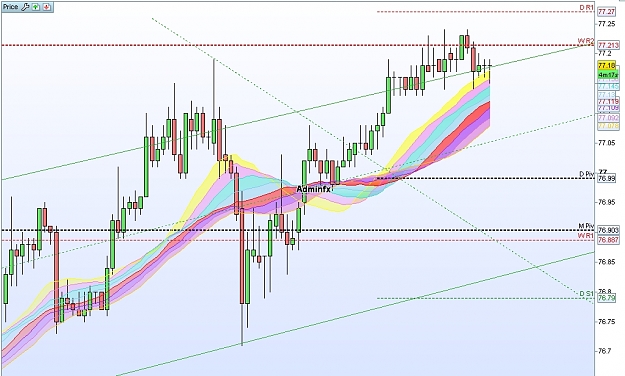
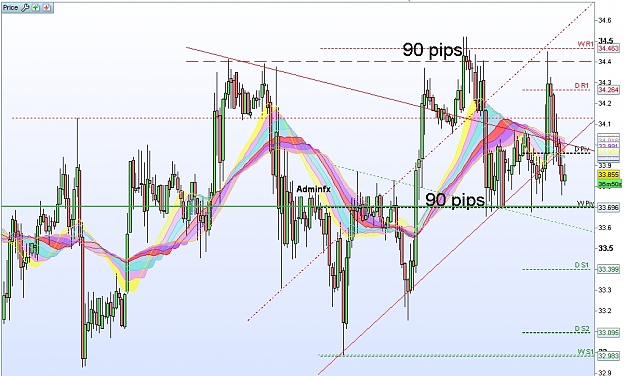
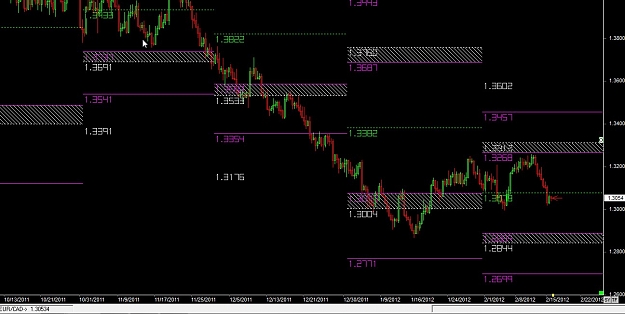
CAD/JPY
Attached Image (click to enlarge)