Disliked
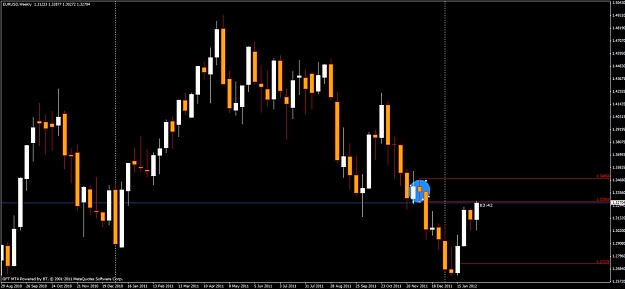
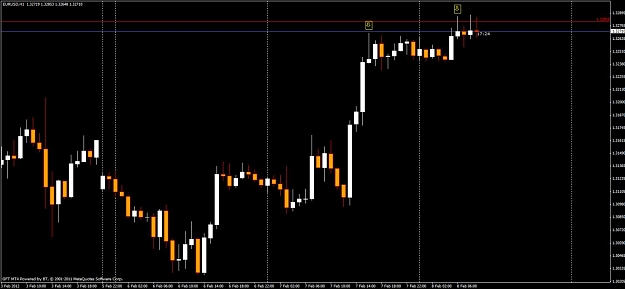
there was a demand level at 1.3110
Entered at 1.3105 when a doji appeared on 30 min.
.Ignored
 B.S. Trading with Kenneth Lee

- #2,464
- Feb 7, 2012 3:38pm Feb 7, 2012 3:38pm
- Joined Nov 2008 | Status: Trade Inspiration Not Despiration . | 4,827 Posts
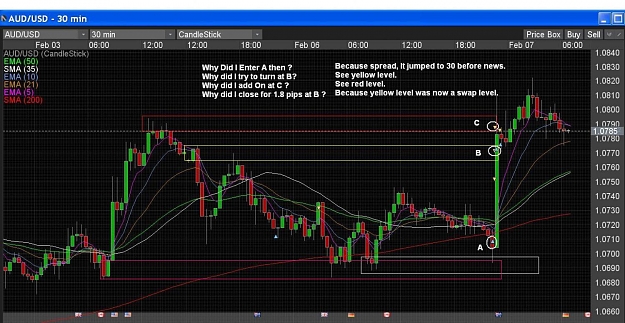
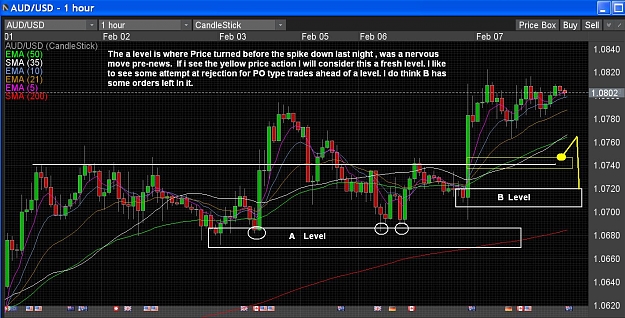
Good Trading To All ; Ken Lee
- #2,466
- Feb 7, 2012 5:50pm Feb 7, 2012 5:50pm
- Joined Nov 2008 | Status: Trade Inspiration Not Despiration . | 4,827 Posts
Good Trading To All ; Ken Lee
- #2,471
- Feb 8, 2012 10:19am Feb 8, 2012 10:19am
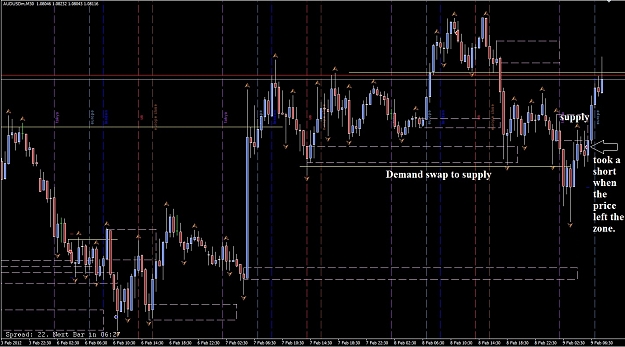
- Joined Feb 2011 | Status: Probabilities, Not Absolutes | 1,246 Posts