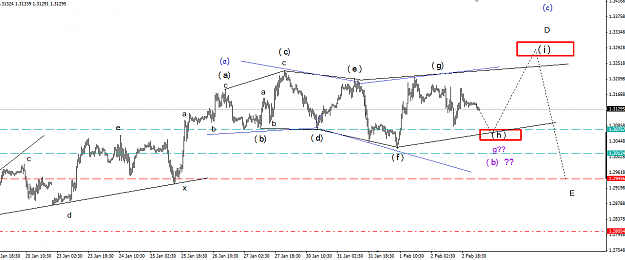
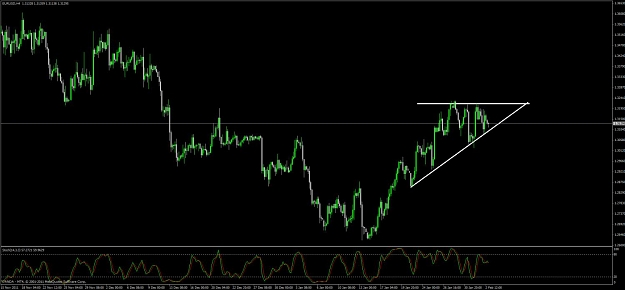
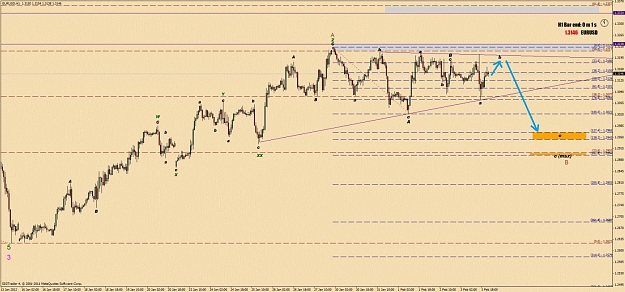
the symmetrical formation continue to unfold. wave (h) should retrace at least 61% of the (f)-wave. the triangle in (h) is very likely, so wave (i) may start well above 1.3076. if it is the case, wave D may end above 1.33.
In a second scenario shown in blue (kudos to knightpips!), after wave x we're looking at the flat with a bowtie-diametric in wave b. we're in a leg g of the diametric right now. wave g should not break 1.3012 level. If price goes below 1.3020 and turning around above 1.3012 then the it's gotta be the wave g of a diametric. this automatically raises the targets for D. Both counts are not ideal, both of them are flawed to the certain extent. BUT, the preferred count remains the first one with symmetrical formation. . Good luck to everyone trading the NFP day!
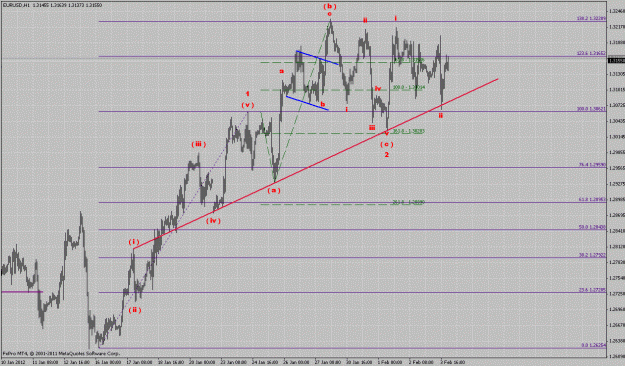
the symmetrical formation continue to unfold. wave (h) should retrace at least 61% of the (f)-wave. the triangle in (h) is very likely, so wave (i) may start well above 1.3076. if it is the case, wave D may end above 1.33.
In a second scenario shown in blue (kudos to knightpips!), after wave x we're looking at the flat with a bowtie-diametric in wave b. we're in a leg g of the diametric right now. wave g should not break 1.3012 level. If price goes below 1.3020 and turning around above 1.3012 then the it's gotta be the wave g of a diametric....
Ignored
Hi
Most of my friends know i use only basic of EW But my system agree with your view.
Only one thing not agree about if PA reach 1.33 i see it will go some more up not drop to 1.29 as u explain.
I like ur count and ur view ,Looks to me Talent trader
GL
Hi
Most of my friends know i use only basic of EW But my system agree with your view.
Only one thing not agree about if PA reach 1.33 i see it will go some more up not drop to 1.29 as u explain.
I like ur count and ur view ,Looks to me Talent trader
GL
Ignored
Thanks, egkid!
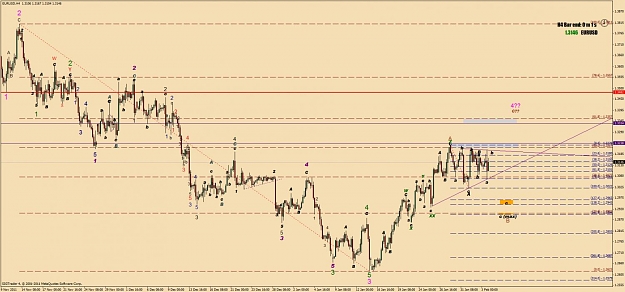
looks like second count is pretty much off the table. wave (h) is shaping up to a contracting triangle (wave e is on the way), the burst to the upside is projected to be between 70 and 170 pips and will take 24 hours give or take. Indeed, 1.33 is an important level, according to the second count, price may reach 1.35-1.36. If first count is taking place then symmetric should end slightly below 1.33
the symmetrical formation continue to unfold. wave (h) should retrace at least 61% of the (f)-wave. the triangle in (h) is very likely, so wave (i) may start well above 1.3076. if it is the case, wave D may end above 1.33.
In a second scenario shown in blue (kudos to knightpips!), after wave x we're looking at the flat with a bowtie-diametric in wave b. we're in a leg g of the diametric right now. wave g should not break 1.3012 level. If price goes below 1.3020 and turning around above 1.3012 then the it's gotta be the wave g of a diametric....
Ignored
Is this Elliott? I don't think so! Correct me if I am wrong!
Thanks, egkid!
looks like second count is pretty much off the table. wave (h) is shaping up to a contracting triangle (wave e is on the way), the burst to the upside is projected to be between 70 and 170 pips and will take 24 hours give or take. Indeed, 1.33 is an important level, according to the second count, price may reach 1.35-1.36. If first count is taking place then symmetric should end slightly below 1.33
Ignored
As i said u r talent and PA going UP as u posted if my Sunday candle close above 3120 will long again.
I long@3080 but closed because weekend and not free to follow.
wish u nice weekend and keep the excellent work.
Egkid
As i said u r talent and PA going UP as u posted if my Sunday candle close above 3120 will long again.
I long@3080 but closed because weekend and not free to follow.
wish u nice weekend and keep the excellent work.
Egkid
Ignored
hi egkid...my friend
how about you? everything is ok.. i mean "the black out" on the last day?
i hope u are okay
ps i dont wanna call uncle T anymore.. or use "uncle" .. cause recently he calls me "Auntie" ... then, call both of u. just by name is ok
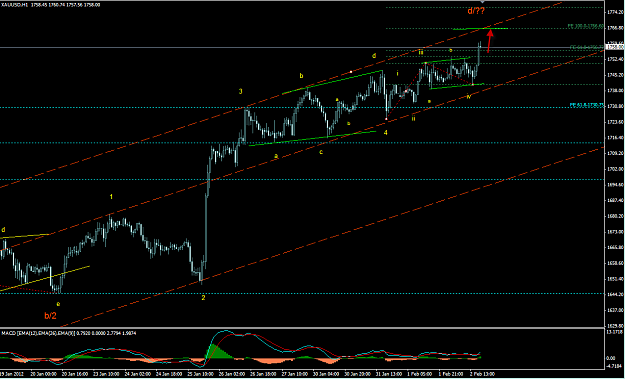
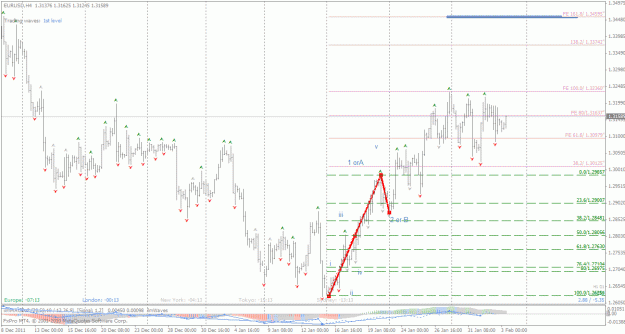
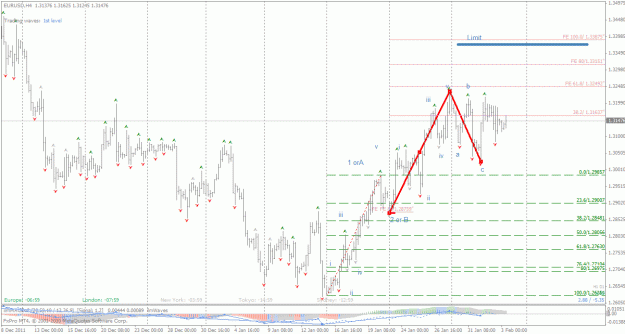
Wave A finished, now complex correction wave B unfolding, with projected levels for end of wave B at two key areas:
1.2965-1.243
or
1.2903- 1.2894 max.
Then we might see more upside that should be limited @ 61.8Fib Ret of longer time frame count (h4) at 1.3334 - 1.3370.
Wave A finished, now complex correction wave B unfolding, with projected levels for end of wave B at two key areas:
1.2965-1.243
or
1.2903- 1.2894 max.
Then we might see more upside that should be limited @ 61.8Fib Ret of longer time frame count (h4) at 1.3334 - 1.3370.
Red line is line in the sand for this EW count.
Ignored
Hi Seb,
very very good count, not only the move down, but the upmove too.
For downside scenario I favor a scenario of 1.2817 - 1.2695 - 1.2573 for an overall upside flat correction. Should retrace at least 90% of wave A or W