I didn't get your point, could you be more clear ?
Ignored
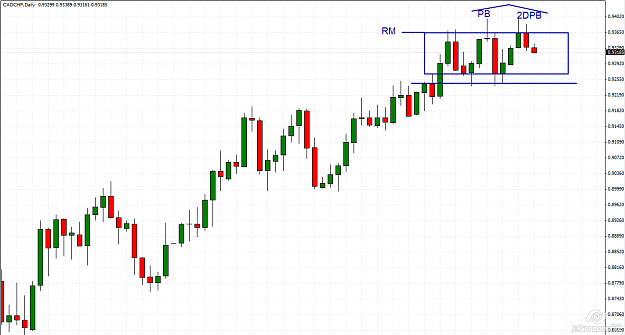
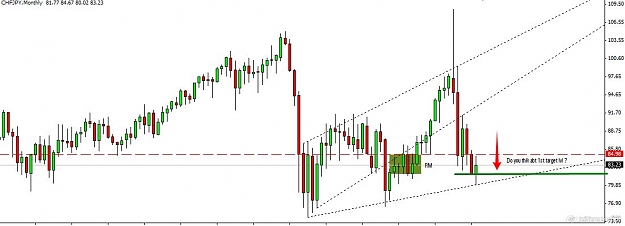
1. In dynamic RM DB or DT have different price levl as attached on my chart, but accordingly to TL seems to be DB
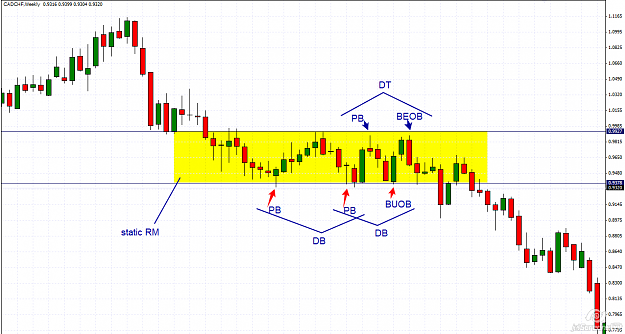
2. In static RM situation is more clear DT or DB have same price lvls or close each other.
Do we have to look to acordingly to TL or to price lvls ?
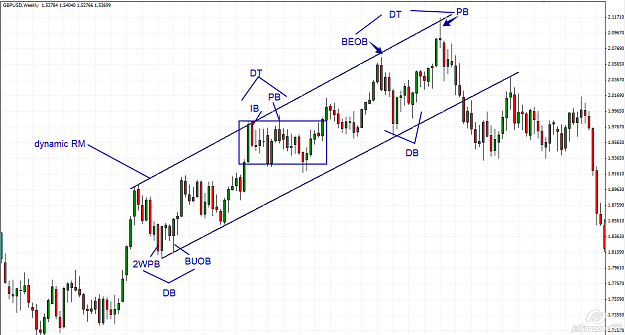
The DT and DB formation, depends on the levels are made. If you are looking to a static RM so it is always better the DB/DT to respect the static level as S/R..meanwhile if you are dealing with a dynamic RM, the DB/DT is always better to respect the dynamic level as S/R.
There are other market elements as exceptions but we will talk about them in a forward stage.
Your post is a very good one and give me the opprtunity to start talking about the RMs.
Perssonaly I trade 2 kind of RMs:
-static RM
-dynamic RM (channels,flags,triangles,etc).
Let's see some exemples of RMs and of course some DT/DB !
Thanks for vy kind explain abt static and dynamic RM and lvl's.
It is vy important to understand buyers and sellers.
You must have a great experience and teaching talent.
Some of the information You placed in previous thread "The Price" which is also really interesting to study.
Thanks for your patiance !
I'll put more chrts to disscuss it is geting more fascinating ...
Quite an intresting way to interpret price action!
Confluence of signals is the key, in my opinion. When you get add the ducks in the row simultaneously, your changes of success is greater.
for example:
-bullish Pinbar formed at strong support level
-Pinbar close above the support (suppport level has passed the strenght test)
-Higher High Higher Low-definition of trend (the moneyflow is up)
-Reward/Risk >2 (open at pinbar close, stoploss at pinbar low, target latest high) (trade is worth of taking, more money behind the trade)
Hi FXgroup,
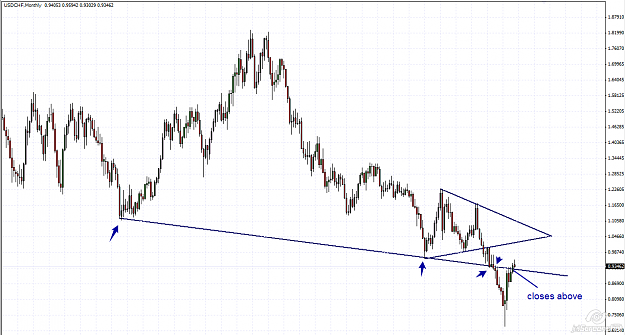
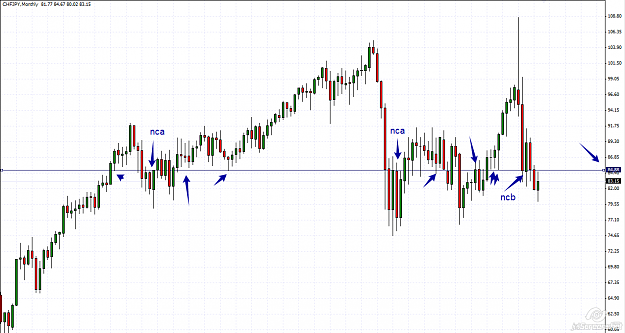
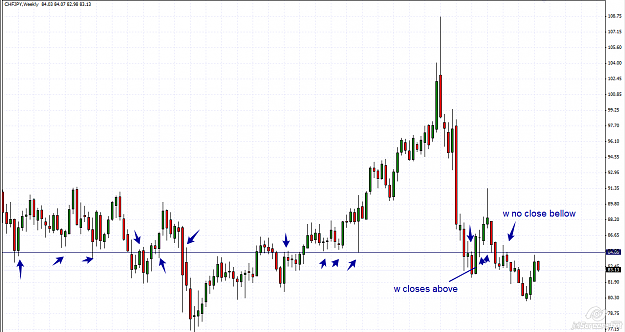
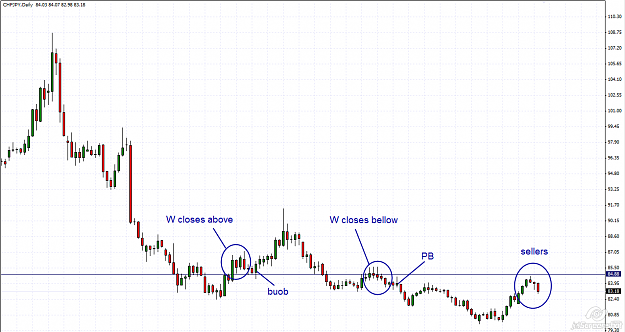
usdchf - last 3 candles (W) on your chart looks like PB (SS) monthly if we look at from wider prespective at chart date.
Should we interpret buyers/sellers as complex of candles or separatly of crouse after candles close ?
All the analiyses are made ONLY when the candle is CLOSED.
As we have been seen, the candle's close is very important and we are using formations such as 2M/ W/ D PC candles, but untill the currently candle is closed, we do nothing.
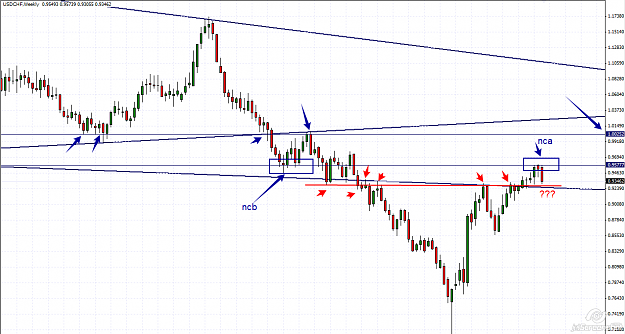
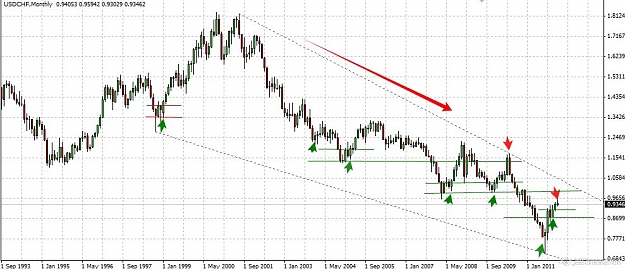
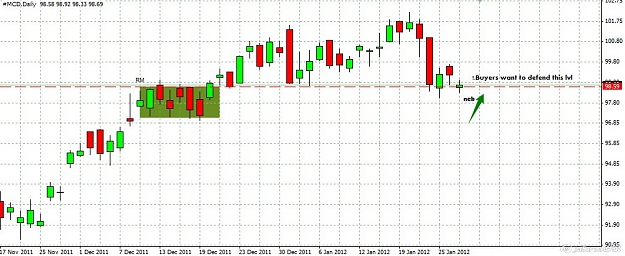
This is a pair with a vry nice situation, the P was in M RM, but now the buyers closed above the R level and are trying to take the level's control.
In the pair's past we see that the P get within an old M RM.
The W is in bullish trend and the D...on the chart !
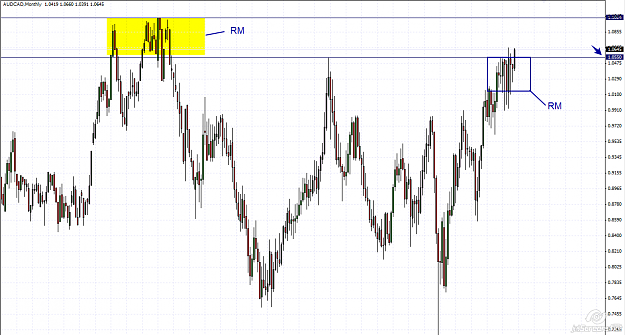
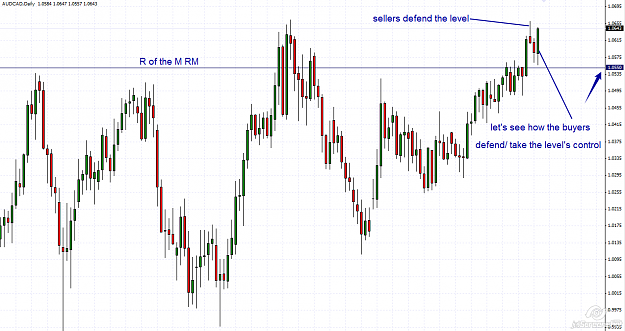
I was going to put same chart AUDCAD ... ;-)
and AUDNZD seems to be interesting , also SP 500 index .
Ignored
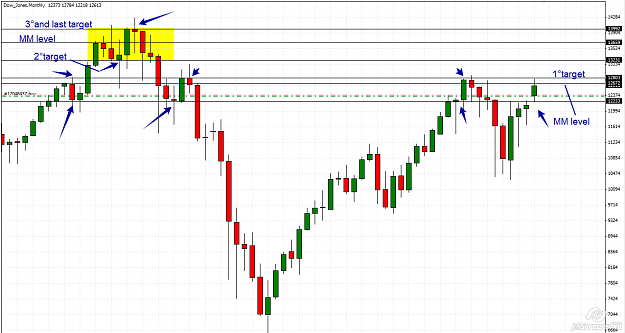
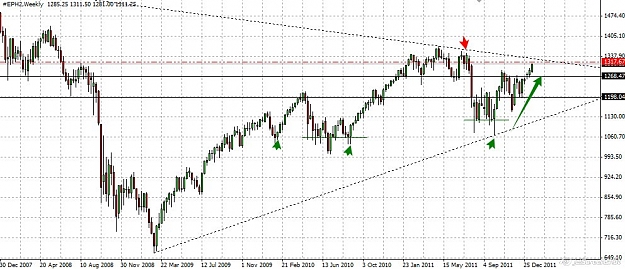
S&P is very similar to DJ and we see that the big move starts with a strong buyers reaction as a M BUOB.
W
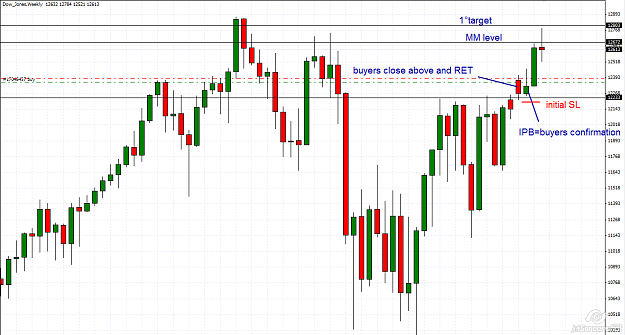
-1- the buyers closed above the 12233 and makes RET to the level as a sign that the sellers defend the 12233 level.
-2-IPB at our level=buyers confirmation.
S&P is very similar to DJ and we see that the big move starts with a strong buyers reaction as a M BUOB.
Ignored
Very good example of PTT & TTP !
I never did my transaction so complex.
As I have limited time this method really fit to me.
I never use any automatic indicators only indicators is what you see on your own chart - PRICE.
82.7 means 1.322-3 eurusd, but as I see from chart 1.32790 is possible from weekly chart.
I wonder if EURUSD hit 1.32300 as my TP from 1.309 of yestarday trade.
there is a lot of corelation between and we have to be very carefull and plan all trades according to these rule "common sense"