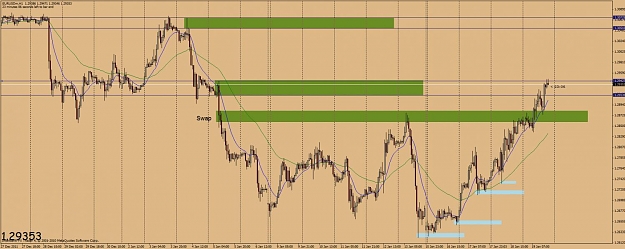
Kenneth, can you help me what happened here in Eur/Usd 1 hour chart
supply is breakout
Ignored
I was attempting to trade that one as well. The supply was used up. I considered the origin of the zone as a swap area on the far left. The first touch in the mid-area of the chart used up supply. Then price hung around the same area a lot last night, also chewing up supply.
If this was not enough there was news with the Pound that added to it plus Spain was selling bonds. Needless to say price eventually moved through. It is not an exact science, that's why it is called trading, sometimes you loose.
Illegitimi non carborundum - Noli pati a scelestis opprimi.
My sell stop activated when price touched the Supply zone.
Lets see how it goes. I have another sell at the Fresh Supply above.
Ignored
Seems like the demand is too strong and price is going up consuming the current supply.
The sell ended with a small loss. Another SELL was activated on the Fresh Supply and I closed it manually for little profit. Now I have another sell an an extreme supply level. Lets see if this works but the bulls are strong.
I was attempting to trade that one as well. The supply was used up. I considered the origin of the zone as a swap area on the far left. The first touch in the mid-area of the chart used up supply. Then price hung around the same area a lot last night, also chewing up supply.
If this was not enough there was news with the Pound that added to it plus Spain was selling bonds. Needless to say price eventually moved through. It is not an exact science, that's why it is called trading, sometimes you loose.
Ignored
Here is a chart.
Looking back on my trading for this area.
1. I was too hung up on going short.
2. I should have taken partial profit with the 30 pips I had one time.
I have been thinking through my trading style with such a market condition.
Under consideration right now
1. Time constraint for how long I hold a position that becomes range bound.
2. Taking partial profits sooner when taking positions that are moving against the bigger picture. I am thinking half or forth the position at 1:1 or so.
Some random thoughts on my third day of missing work for being snowed and iced in.
Rufus
Attached Image (click to enlarge)
Illegitimi non carborundum - Noli pati a scelestis opprimi.
I did have a PO set at the level you shorted. Then once the spikes came close I deleted it. Spikes up so close eating all supply to me. I didn't like how it arrived. We had a zone roughly 25 pips wide. I include the 5 pips above that we add for our zone's. Zone was about 20 pips wide with entry and add 5 over high and we got 25. So at that point I need a minimum of 50 pips. 2807 put us at 50. Its at the end of candle wicks not at a base. To me not 2 to 1 so its scratched immediately. Now you can scalp it and look for 10 to 15 and would of got it....
Ignored
At firsts, those spikes told me that there is still supply a bit lower than the marked supply zone. Some demand was absorbed by that supply but it seems a lot was still present.
The bulls have a strong momentum. Demand is great but there are more supply levels ahead.
Well I waited all day took a few pips on the way up and I have now entered short at daily supply. Four days straight up is a nice pace into this level and should insure little demand on the way down, if the daily level holds. If this daily supply gets broken I will shift my bias to longs. This is a good looking daily level with a strong move down and good R:R. I expect to take a little heat on this as the 1.30 BRN will be almost irresistable to the asians tonite but Fridays are historically bad for markets and the greeks still are in play with the debt negotiations. Well it'll either win or fail just another trade.
the same thing happened on 4 hour chart like 1 hour chart
any body can tell me the cause of failure supply on 1 hour chart and 4 hour chart is .....demand on weekly chart
is that true or there is another perfect answer
Ignored
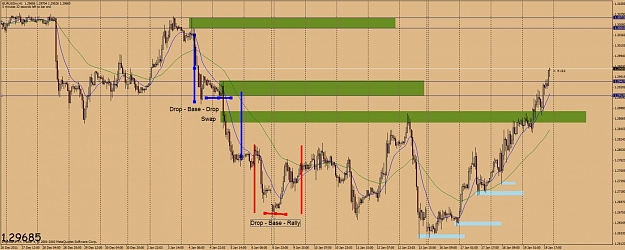
Zones are formed different ways. A drop - base - Rally has more potential to be a stronger demand area then a Rally Base Rally.
Sam Seiden's main focus would be on D-B-R or R-B-D. I guess technically speaking a D-B-D such as is indicated could be considered a very large "Swap" area as Ken has called them.. So the strength of the zone may be in question.
If Price can turn on a dime with a nickle left over you have a good indication of the strength of the Zone.
Price turns on swap areas all the time. So we do our best to pick out the best ones and if we lose go to the next. Remembering that frustration can be a thought away. I have learned about myself that when frustration sets in I need to get away from the computer positions on or not.
Attached Image (click to enlarge)
Illegitimi non carborundum - Noli pati a scelestis opprimi.
. So we do our best to pick out the best ones and if we lose go to the next. Remembering that frustration can be a thought away. I have learned about myself that when frustration sets in I need to get away from the computer positions on or not.
Originally Posted by Rufushttp://www.forexfactory.com/images/buttons/viewpost.gif
[i]I was attempting to trade that one as well. The supply was used up. I considered the origin of the zone as a swap area on the far left. The first touch in the mid-area of the chart used up supply. Then price hung around the same area a lot last night, also chewing up supply.
If this was not enough...
Hey , go easy on me.. this is my very first post.
I just stumbled onto S.Seiden supply/demand approach just a few days ago. It makes a lot of sense to me, after years of wandering in indicatorville. Simple? maybe..Easy?..nothing is easy, that's why i am appreciating soo much the wisdom and good knowledge expressed in this thread. Thank you very much to all of you.
I had the same question about the euro blowing thru supply and I thought I drew the lines wrong....but it makes a lot more sense what you suggest...bull sitting at level all night, chewing thru orders..
Lot's of question..but i don't want to be a total newbie..got to do me homework first.
Thanks again
the same thing happened on 4 hour chart like 1 hour chart
any body can tell me the cause of failure supply on 1 hour chart and 4 hour chart is .....demand on weekly chart
is that true or there is another perfect answer
Ignored
Hi gozila,
I had spot the level as you spot. I set a pending order right over there last week, but when the price is coming back to the level, I deleted the PO because of the reasons below
1. it's an up trend.
2. the arrival of the price is so ugly.
I always follow the big TF trend. I will only take a counter trend trade in a big TF if the odd enhancers score is 10 (full marks). I didn't look at Weekly time frame. but I will take a look at Weekly if I'm trading Daily timeframe.
These are the reasons I cancel my PO.
Wish all Chinese traders Happy Chinese New Year, have a great DRAGON year.
Hey , go easy on me.. this is my very first post.
I just stumbled onto S.Seiden supply/demand approach just a few days ago. It makes a lot of sense to me, after years of wandering in indicatorville. Simple? maybe..Easy?..nothing is easy, that's why i am appreciating soo much the wisdom and good knowledge expressed in this thread. Thank you very much to all of you.
I had the same question about the euro blowing thru supply and I thought I drew the lines wrong....but it makes a lot more sense what you suggest...bull sitting at level all night, chewing...
Ignored
Welcome...No such thing as a bad question here. As for blowing the zone see image
Attached Image
Illegitimi non carborundum - Noli pati a scelestis opprimi.
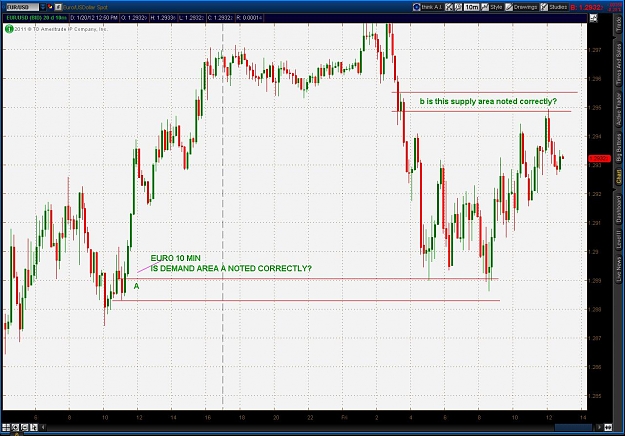
Kenneth, thank you so very much for the excellent work you are doing.
Working my way thru the thread, and find the quality outstanding.
I have a question about proper notation of the zones, so i am posting this picture of the current euro 10 min.
Anybody that cares to comment i will appreciate it.
A.
Welcome...No such thing as a bad question here. As for blowing the zone see image
Ignored
Hey Rufus
Your quote " So we do our best to pick out the best ones and if we lose go to the next. Remembering that frustration can be a thought away. I have learned about myself that when frustration sets in I need to get away from the computer positions on or not. " We stated as other have said.
I would offer up 2 observations that may help some regarding the PA of the EU.. Questons posted by Gozila..regarding the 1H and 4H TF.
Someone had mentioned supply was being eaten away so eventually PA went long through the supply area. Several things we need to look at when we are in the trade.
1) Has PA started to "aggressively" move away from our entry area? If not ?? Then we must consider the longer we wait for price to move away from our enrty the more this zone become weak. The EU example was a good example of this. Remember GL 's comments about how price approaches our area.. Does price move smartly toward our S/D area or is it just meandering?
A good example of this is .. See the price level on the 1H EU @ 1.28 area.. See how price move toward this level.. Smartly, not a lot of meandering. Then it turned sharply down, not a lot of time spent at this supply level..just took off to the 1.2730 level..
Now look at the level GZ is refering too. See how price is approaching 1.2860 area.. Really choppy, meandering.. PA once there , just stayed.. did not turn short as the better trades do. This is were I think a trader need to decide.. Do I stay?? Is PA acting like it normally does.. Or do I get out.. My opinion.. Price spends to much time I'm out.. It's not acting normal to me.. ( IMHO )
Lastly and most important.......
2) Post # 2172 by ydaudw...
"Sam Saiden Odd enhancer, check "larger time frame levels". Seems that the Demand still strong."
PA took a bounce off this Supply area.. So the pressure is now long. We are in a counter trend looking at were were are on the daily. Mixed signals ( daily down, price previously hitting demand zone on the daily )
Going short here might have its difficulties. Does than mean that it will not go short off a supply area ( NO ) but the preasure is to the long side. If we look at what price is doing from this previous Demand Zone. Simply, you are trying to go short on a Daily TF Demand Area near its begining. We know that PA when leaving these areas can be strong. One needs to be aware of this and manage the trade accordingly.
Yes, Sam Saiden Odd enhancer, check "larger time frame levels.. And that the Daily is in a down trend.. I would offer that this bounce of the demand zone may trump that...
It is the method that we trade and we tend to trade from one zone to the other.
We all get caught up in the micro view and we forget to look at the macro view Sam Saiden Odd enhancer, check "larger time frame levels...
Just one person point of view...Feel free to add your comments..
The comment made by anthony tzw is spot on IMHO
"I always follow the big TF trend. I will only take a counter trend trade in a big TF if the odd enhancers score is 10 (full marks). I didn't look at Weekly time frame. but I will take a look at Weekly if I'm trading Daily timeframe. These are the reasons I cancel my PO. "
Joined Feb 2009
|
Status: Illegitimi non carborundum
|3,526 Posts
I am your constant companion;
I am your greatest helper or your heaviest burden.
I will push you onward or drag you down to failure.
I am at your command.
Half of the tasks that you do you might just as well
Turn over to me and I will do them quickly and correctly.
I am easily managed; you must merely be firm with me.
Show me exactly how you want something done.
After a few lessons, I will do it automatically.
I am the servant of all great people
and the regret of all failures as well.
Those who are great, I have made great.
Those who are failures, I have made failures.
I am not a machine but I will work with all its precision
Plus the intelligence of a person.
Now you may run me for profit or you may run me for ruin.
It makes no difference to me.
Take me, train me, be firm with me and
I will lay the world at your feet.
Be easy with me and I will destroy you.
I am called Habit!
Quote:
author unknown
Illegitimi non carborundum - Noli pati a scelestis opprimi.
Hey Ken and all. Excellent thread. Was going thru Sam's stuff on FXStreet. Wanted to go deeper into Supply/Demand but couldn't fork out the $$$$ for XLT and came across this thread. Really useful. Will try and contribute to the thread and post trades for analysis and critique where possible. Cheers

![Click to Enlarge
Name: nzdusd1h].gif
Size: 15 KB](/attachment/image/879642/thumbnail?d=1365740914)