Hello all,
If I may, I would like to offer the forum the results of over six months work I have just finished to try to answer a question I have long had, on what is the optimum timeframe to trade.
I appreciate that there is no definitive answer to this, but here is my analysis...
I have had this in mind for a while but could never gain access to sufficient data until recently, when I acquired some very high quality institutional tick-data going back decades (to Deutsche Marks etc!!) from a "friend of a friend...".
I could tell it was going to be a long job when a box turned up containing a considerable number of 1Tb hard discs, LOL!!
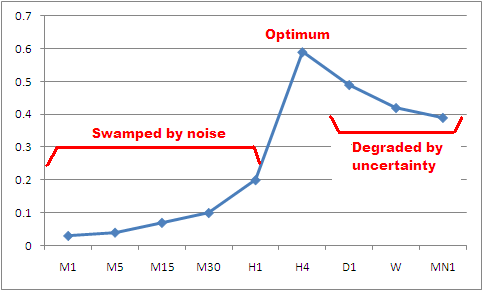
Well.... I did over 40 Matlab worksheets and produced dozens of charts... but to cut a long story short to save boring everyone with the gory details, my results can in some respects be summarised in the attached chart.
This shows the mutual information for different MT4 timeframes. This is a rigorous mathematical measure of the amount of information you can obtain about the value of one variable knowing another.
To save you looking it up, Wikipedia has the following:
---------
Definition of mutual information
Formally, the mutual information of two discrete random variables X and Y can be defined as:
http://upload.wikimedia.org/wikipedi...932a5cd4ff.png
where p(x,y) is the joint probability distribution function of X and Y, and p(x) and p(y) are the marginal probability distribution functions of X and Y respectively.
In the case of continuous random variables, the summation is matched with a definite double integral:
http://upload.wikimedia.org/wikipedi...f3bc596994.png
where p(x,y) is now the joint probability density function of X and Y, and p(x) and p(y) are the marginal probability density functions of X and Y respectively.
These definitions are ambiguous because the base of the log function is not specified. To disambiguate, the function I could be parameterized as I(X,Y,b) where b is the base. Alternatively, since the most common unit of measurement of mutual information is the bit, a base of 2 could be specified.
Intuitively, mutual information measures the information that X and Y share: it measures how much knowing one of these variables reduces uncertainty about the other. For example, if X and Y are independent, then knowing X does not give any information about Y and vice versa, so their mutual information is zero. At the other extreme, if X and Y are identical then all information conveyed by X is shared with Y: knowing X determines the value of Y and vice versa. As a result, in the case of identity the mutual information is the same as the uncertainty contained in Y (or X) alone, namely the entropy of Y (or X: clearly if X and Y are identical they have equal entropy).
Mutual information quantifies the dependence between the joint distribution of X and Y and what the joint distribution would be if X and Y were independent. Mutual information is a measure of dependence in the following sense: I(X; Y) = 0 if and only if X and Y are independent random variables. This is easy to see in one direction: if X and Y are independent, then p(x,y) = p(x) p(y), and therefore:
http://upload.wikimedia.org/wikipedi...86e86dc85e.png
Moreover, mutual information is nonnegative (i.e. I(X;Y) ≥ 0; see below) and symmetric (i.e. I(X;Y) = I(Y;X)).
Mutual information can be equivalently expressed as
http://upload.wikimedia.org/wikipedi...caffb4df40.png
where H(X) and H(Y) are the marginal entropies, H(X|Y) and H(Y|X) are the conditional entropies, and H(X,Y) is the joint entropy of X and Y. Since H(X) ≥ H(X|Y), this characterization is consistent with the nonnegativity property stated above.
Intuitively, if entropy H(X) is regarded as a measure of uncertainty about a random variable, then H(X|Y) is a measure of what Y does not say about X.
This is "the amount of uncertainty remaining about X after Y is known", and thus the right side of the first of these equalities can be read as "the amount of uncertainty in X, minus the amount of uncertainty in X which remains after Y is known", which is equivalent to "the amount of uncertainty in X which is removed by knowing Y". This corroborates the intuitive meaning of mutual information as the amount of information (that is, reduction in uncertainty) that knowing either variable provides about the other.
---------
In our case, we want an estimate of how much useful information is contained in the current chart concerning possible future price moves. This is particularly important for folk who use indicators, as these are calculated off the current chart data. So it is very useful to know how much information they might actually contain about possible future moves.
It may come as no surprise that the lowest timeframes have the lowest values. The graph reaches a peak at H4, then tails off.
The reason for the poor performance at short timeframes is well known -- the signal-to-noise ratio is poor.
At higher timframes (Daily and above), I speculate that the reason may well be uncertainty degrading the performance. That is, over a timescale of weeks or months, it is quite possible for wars etc to start, whereas it is unlikely a war or something will start in the next few hours if we haven't heard anything ominous at the current time.
So the short timeframes are degraded by noise and the very long ones by uncertainty.
Of course, this doesn't mean scalpers can't make money. It just means you need to be more skilled and experienced to do so.
Every professional trader I have ever spoken to recommends newbies to start trading on the Daily TF until you acquire the experience to tackle the faster ones.
Now perhaps we can see why....
I hope this is helpful and, as ever, I welcome sensible feedback from experienced traders who may have something to add...
Kind regards,
Old Dog
.
If I may, I would like to offer the forum the results of over six months work I have just finished to try to answer a question I have long had, on what is the optimum timeframe to trade.
I appreciate that there is no definitive answer to this, but here is my analysis...
I have had this in mind for a while but could never gain access to sufficient data until recently, when I acquired some very high quality institutional tick-data going back decades (to Deutsche Marks etc!!) from a "friend of a friend...".
I could tell it was going to be a long job when a box turned up containing a considerable number of 1Tb hard discs, LOL!!
Well.... I did over 40 Matlab worksheets and produced dozens of charts... but to cut a long story short to save boring everyone with the gory details, my results can in some respects be summarised in the attached chart.
This shows the mutual information for different MT4 timeframes. This is a rigorous mathematical measure of the amount of information you can obtain about the value of one variable knowing another.
To save you looking it up, Wikipedia has the following:
---------
Definition of mutual information
Formally, the mutual information of two discrete random variables X and Y can be defined as:
http://upload.wikimedia.org/wikipedi...932a5cd4ff.png
where p(x,y) is the joint probability distribution function of X and Y, and p(x) and p(y) are the marginal probability distribution functions of X and Y respectively.
In the case of continuous random variables, the summation is matched with a definite double integral:
http://upload.wikimedia.org/wikipedi...f3bc596994.png
where p(x,y) is now the joint probability density function of X and Y, and p(x) and p(y) are the marginal probability density functions of X and Y respectively.
These definitions are ambiguous because the base of the log function is not specified. To disambiguate, the function I could be parameterized as I(X,Y,b) where b is the base. Alternatively, since the most common unit of measurement of mutual information is the bit, a base of 2 could be specified.
Intuitively, mutual information measures the information that X and Y share: it measures how much knowing one of these variables reduces uncertainty about the other. For example, if X and Y are independent, then knowing X does not give any information about Y and vice versa, so their mutual information is zero. At the other extreme, if X and Y are identical then all information conveyed by X is shared with Y: knowing X determines the value of Y and vice versa. As a result, in the case of identity the mutual information is the same as the uncertainty contained in Y (or X) alone, namely the entropy of Y (or X: clearly if X and Y are identical they have equal entropy).
Mutual information quantifies the dependence between the joint distribution of X and Y and what the joint distribution would be if X and Y were independent. Mutual information is a measure of dependence in the following sense: I(X; Y) = 0 if and only if X and Y are independent random variables. This is easy to see in one direction: if X and Y are independent, then p(x,y) = p(x) p(y), and therefore:
http://upload.wikimedia.org/wikipedi...86e86dc85e.png
Moreover, mutual information is nonnegative (i.e. I(X;Y) ≥ 0; see below) and symmetric (i.e. I(X;Y) = I(Y;X)).
Mutual information can be equivalently expressed as
http://upload.wikimedia.org/wikipedi...caffb4df40.png
where H(X) and H(Y) are the marginal entropies, H(X|Y) and H(Y|X) are the conditional entropies, and H(X,Y) is the joint entropy of X and Y. Since H(X) ≥ H(X|Y), this characterization is consistent with the nonnegativity property stated above.
Intuitively, if entropy H(X) is regarded as a measure of uncertainty about a random variable, then H(X|Y) is a measure of what Y does not say about X.
This is "the amount of uncertainty remaining about X after Y is known", and thus the right side of the first of these equalities can be read as "the amount of uncertainty in X, minus the amount of uncertainty in X which remains after Y is known", which is equivalent to "the amount of uncertainty in X which is removed by knowing Y". This corroborates the intuitive meaning of mutual information as the amount of information (that is, reduction in uncertainty) that knowing either variable provides about the other.
---------
In our case, we want an estimate of how much useful information is contained in the current chart concerning possible future price moves. This is particularly important for folk who use indicators, as these are calculated off the current chart data. So it is very useful to know how much information they might actually contain about possible future moves.
It may come as no surprise that the lowest timeframes have the lowest values. The graph reaches a peak at H4, then tails off.
The reason for the poor performance at short timeframes is well known -- the signal-to-noise ratio is poor.
At higher timframes (Daily and above), I speculate that the reason may well be uncertainty degrading the performance. That is, over a timescale of weeks or months, it is quite possible for wars etc to start, whereas it is unlikely a war or something will start in the next few hours if we haven't heard anything ominous at the current time.
So the short timeframes are degraded by noise and the very long ones by uncertainty.
Of course, this doesn't mean scalpers can't make money. It just means you need to be more skilled and experienced to do so.
Every professional trader I have ever spoken to recommends newbies to start trading on the Daily TF until you acquire the experience to tackle the faster ones.
Now perhaps we can see why....
I hope this is helpful and, as ever, I welcome sensible feedback from experienced traders who may have something to add...
Kind regards,
Old Dog
.
Attached Image