• Home
  • Forums
  • Trades
  • News
  • Calendar
  • Market
  • Brokers
  • Login
  • Join
  • User/Email: Password:
  • 4:55pm
Menu
  • Forums
  • Trades
  • News
  • Calendar
  • Market
  • Brokers
  • Login
  • Join
  • 4:55pm
Sister Sites
  • Metals Mine
  • Energy EXCH
  • Crypto Craft

Options

Bookmark Thread

First Page First Unread Last Page Last Post

Print Thread

Similar Threads

Sheep or Lion? 13 replies

Hunt & Trades Futures From Futures Hunter 8 replies

ODL stop hunt? 1 reply

The hunt for 4 pips... 3 replies

Yet another Stop hunt :? a conspiracy theory 10 replies

  • Trading Journals
  • /
  • Reply to Thread
  • Subscribe
  • 50
Attachments: Red Lion on the hunt
Exit Attachments

Red Lion on the hunt

  • Last Post
  •  
  • 1 Page 2345 6
  • 1 Page 234 6
  •  
  • Post #21
  • Quote
  • Jan 7, 2012 1:58pm Jan 7, 2012 1:58pm
  •  RodMca
  • | Joined Jul 2011 | Status: Member | 661 Posts
Quoting bumapatria
Disliked
perhaps his hourly is his "direction" for bigger view of market and its the median of time frames i think.. coz like daily is too big, maybe 4h is too big too. m5 is for timing maybe for what he sees on 5min?
Ignored
Perhaps you are correct. If you are well then we have conflicting view points as to which time frames give the best indication of deirection. Of course it is good to have a knowledge of the higher TF I often use the 1day to look at tomorrows directional movement. But for me when I get up at the London open I don't go to my daily or monthly or 4H. I look at these after NY close to see if we broke through any strong s/r and see how price acted at those levels..
But that's it they tell me nothing but what happened in the past..
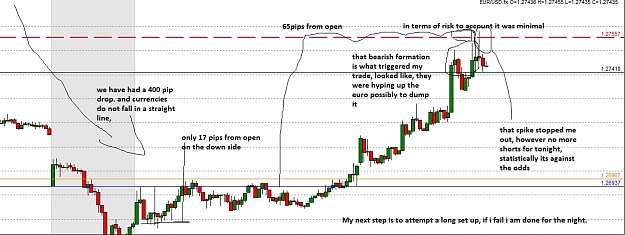
When I get up at the London open I dont look at the 1day to see what the next move is nor the 1H..
I look at M5 and M15, we see price going up on the M5 then we look at our M15. If we have a buy signal with my system on the M5 and M15 then we take a trade..
I use two TF's for confirmation that the short term trend is now becoming the daily trend, or for the most part of it..

Perhaps you and red like to look at larger time frames to get an indication, I know when I signed up for webinars with my broker thats what they also thought us to do.. But for me its the oppposite...
 
 
  • Post #22
  • Quote
  • Jan 7, 2012 2:16pm Jan 7, 2012 2:16pm
  •  the redlion
  • Joined Jan 2011 | Status: Member | 2,680 Posts
Time Frames do not exist.

in reality the movement of the quotes bid/ask recorded in the transaction record aka the chart over x period of time is actually what we see.

if the price is 1.2950 that will be the price at the monthly,tick,hourly,4hour,weekly,30min 15 min.

what some people fail to realize is that we are trading the SAME pair, so looking at time frames as different markets is inaccurate.

i use the 1hr because it is easier to measure the movement of the euro in those increments.

1hr
daily
monthly

and the five minute, as buma said for timing, it's more a habit than a real reason i could as well use the tick or the minute.

and i do use an average with standard deviations (2) if you look at my hourly chart,

BB is 24, the reason is 24 hrs = 1 day.
AVT INVENIAM VIAM AVT FACIAM
 
 
  • Post #23
  • Quote
  • Jan 7, 2012 2:20pm Jan 7, 2012 2:20pm
  •  the redlion
  • Joined Jan 2011 | Status: Member | 2,680 Posts
Quoting RodMca
Disliked
Perhaps you are correct. If you are well then we have conflicting view points as to which time frames give the best indication of deirection. Of course it is good to have a knowledge of the higher TF I often use the 1day to look at tomorrows directional movement. But for me when I get up at the London open I don't go to my daily or monthly or 4H. I look at these after NY close to see if we broke through any strong s/r and see how price acted at those levels..
But that's it they tell me nothing but what happened in the past..
When I get up at the...
Ignored
you are 100% correct in the fact that the market is down to up, not a up to down.

you see what happens in the tick will be recorded in in the minute
and 5 one minutes = 5 min
60 = 1hr
1440= one day and so on

but looking top to bottom tells you the force behind, and conviction of the traders.

example for the past 3 days we have been going down, selling pressure is evident, what does this mean?

a correction is eminent, or continuation?

we will never know, so being able to accurately measure what is going on NOW (market open on sunday) in relationship to this is crucial, however at the end of the day i just a guess, and therefore the money management is the other half equally important.
AVT INVENIAM VIAM AVT FACIAM
 
 
  • Post #24
  • Quote
  • Jan 7, 2012 2:26pm Jan 7, 2012 2:26pm
  •  the redlion
  • Joined Jan 2011 | Status: Member | 2,680 Posts
that will be the other objective test of this journal.

1st part, will be finding the best possible strategic entrance of the current trading day, once this is perfected.

the next part is, is it better to trade the daily fluctuations in the direction of intended daily close? as opposed to ignore the fluctuation for the general movement

in other words is Heisenberg uncertainty principle where you cannot accurately know current position and pin point future location true?

or can we in fact be more profitable by (same directional bias) but riding the intraday waves to further reduce risk exposure, or this in fact increases the risk exposure.

decreased holding time= less of a guess
however increased entrances = higher probability of error
AVT INVENIAM VIAM AVT FACIAM
 
 
  • Post #25
  • Quote
  • Jan 7, 2012 2:40pm Jan 7, 2012 2:40pm
  •  RodMca
  • | Joined Jul 2011 | Status: Member | 661 Posts
Quoting the redlion
Disliked
you are 100% correct in the fact that the market is down to up, not a up to down.

you see what happens in the tick will be recorded in in the minute
and 5 one minutes = 5 min
60 = 1hr
1440= one day and so on

but looking top to bottom tells you the force behind, and conviction of the traders.

example for the past 3 days we have been going down, selling pressure is evident, what does this mean?

a correction is eminent, or continuation?

we will never know, so being able to accurately measure what is going on NOW (market open on sunday) in relationship...
Ignored
Ok, I get what you are saying that price is the same no matter what TF youre looking at. I also agree that it is a good indicator to show traders conviction.
However I for one have not developed the skill or the system to pick out the tops and bottoms as our friend Piptrapper does so well. Nor do I have the psychological edge to let my trades ride the price waves for that long.

That is why I trade smaller TF's.. You ask the question "a correction is eminent, or continuation?" like you say its impossible to know, Fridays candle bar will not tell you this. Monday's M5 and M15 may indeed tell you.
We get a buy signal at the London open I'll gladly open a long.. If it is a correction developing I've mot likely caught the bottom. I use 5sma and 10sma as well as 50ema on my charts.. These give me almost perfect entry and exit points for intraday trading. That is only for currencies though!

Commodities are a different story.. I Have to use a higher time frame for trading them.. But that is just a volatility matter. For me currencies often flow nicely unless youre trading yen which spikes all over the place while still maintaining a trend..

I think I'm babbling on so I'll stop typing now

ADD: I also agree MM is the more important half of the battle without that you won't last no matter what system you're using!
 
 
  • Post #26
  • Quote
  • Jan 7, 2012 2:45pm Jan 7, 2012 2:45pm
  •  bumapatria
  • Joined Aug 2011 | Status: Member | 10,724 Posts
Quoting the redlion
Disliked
Time Frames do not exist.

in reality the movement of the quotes bid/ask recorded in the transaction record aka the chart over x period of time is actually what we see.

if the price is 1.2950 that will be the price at the monthly,tick,hourly,4hour,weekly,30min 15 min.

what some people fail to realize is that we are trading the SAME pair, so looking at time frames as different markets is inaccurate.

i use the 1hr because it is easier to measure the movement of the euro in those increments.

1hr
daily
monthly

and the five minute, as buma said...
Ignored
that is very true - its the same darn thing. but since they manipulate our eyes (candles and bars) we can see quite the different "instruments" on different "timeframes" of price visualization.

my questions to you:

quote:
"
the next part is, is it better to trade the daily fluctuations in the direction of intended daily close? as opposed to ignore the fluctuation for the general movement
"


or can we in fact be more profitable by (same directional bias) but riding the intraday waves to further reduce risk exposure, or this in fact increases the risk exposure.?

"

so both are riding the trends correct? what im understanding is in method / experiment #1 u are going to reach for daily close, but in method 2 u are going to just ride the intraday waves correct?
and see which is more profitable than the other?


from what i think it could be random or unpredictable from now. a daily close could be creating a bullish movement driving price back so a wave up (if ur intended prediction for a bearish close). making a "daily pinbar". taht would minimze profits. yet only riding one wave or 3 or whatever in intraday moves, could minimize too by not aiming for a possibly extreme bearish close near the lows -

only one way to find out - to try.


so ure using live account for this correct?
Have I got something on my face, SOLDIER?
 
 
  • Post #27
  • Quote
  • Jan 7, 2012 3:01pm Jan 7, 2012 3:01pm
  •  bumapatria
  • Joined Aug 2011 | Status: Member | 10,724 Posts
aha more question on the topic of bollingers and volatility - sorry for the barrage of questions but i really am curious about the way you trade volatility -

here i got examples of where would u take a trade - this is a old template i got and thoguht i would get more insight on it from you

try to ignore the fractals and the alligator


how would u react to a bb breakout? where volatility is huge and out of the mean?

or do u prefer to trade within the mean of volatility and expect a breakout ?
Attached Image (click to enlarge)
Click to Enlarge

Name: intraday_chann.png
Size: 57 KB
Have I got something on my face, SOLDIER?
 
 
  • Post #28
  • Quote
  • Jan 7, 2012 3:01pm Jan 7, 2012 3:01pm
  •  the redlion
  • Joined Jan 2011 | Status: Member | 2,680 Posts
yeah live, demo would not be worth it, i wont take it seriously if it was demo.


1st method the premise is that it will close above or below open and the fluctuations are not that important as they are random and can fake you out, the importance in the general direction,

Attached Image (click to enlarge)
Click to Enlarge

Name: firstmethod.jpg
Size: 132 KB


2nd method is each consolidation can be a potential reversal and one needs to decrease our risk and re enter when resume direction is clear
Attached Image (click to enlarge)
Click to Enlarge

Name: second method.png
Size: 30 KB
AVT INVENIAM VIAM AVT FACIAM
 
 
  • Post #29
  • Quote
  • Jan 7, 2012 3:05pm Jan 7, 2012 3:05pm
  •  the redlion
  • Joined Jan 2011 | Status: Member | 2,680 Posts
some one asked me this and it is important to clarify what i mean with leverage.

i do not mean lots i mean net leverage

so this method can be applied to a 500 usd account as well as a 500,000,000 account

1:3 leverage is (account size) x (3)

1000: 3000
5000:15000
20000:60000
100,000:300,000 etc


1:2 (account size) x (2)
500:1000
1000:2000
15000:3000
100,000:200,000

1:1 is just your account size in the market with no leverage


if you are using micro, mini, or standard it matters little what i mean is the units of currency you control
AVT INVENIAM VIAM AVT FACIAM
 
 
  • Post #30
  • Quote
  • Jan 7, 2012 3:10pm Jan 7, 2012 3:10pm
  •  the redlion
  • Joined Jan 2011 | Status: Member | 2,680 Posts
Attached Image (click to enlarge)
Click to Enlarge

Name: buma.jpg
Size: 178 KB
AVT INVENIAM VIAM AVT FACIAM
 
 
  • Post #31
  • Quote
  • Jan 7, 2012 3:13pm Jan 7, 2012 3:13pm
  •  bumapatria
  • Joined Aug 2011 | Status: Member | 10,724 Posts
Quoting the redlion
Disliked
Attachment 870733
Ignored
okay thanks for clarification - but u still didnt mention if u trade volatility breakouts though..

i mean how would u react to it is my question.

perhaps trade it? or let it settle or retrace .... or something


im really hooked so bear with me
Have I got something on my face, SOLDIER?
 
 
  • Post #32
  • Quote
  • Jan 7, 2012 3:16pm Jan 7, 2012 3:16pm
  •  the redlion
  • Joined Jan 2011 | Status: Member | 2,680 Posts
it depends

it its in the direction of trend probably, but statistically i do not do well with breakouts, i do better with anticipating a change in direction at the distribution stage at loss of momentum

i have gotten burned by fake outs more often than not.

ideally i would have been in the trade already
AVT INVENIAM VIAM AVT FACIAM
 
 
  • Post #33
  • Quote
  • Jan 7, 2012 3:25pm Jan 7, 2012 3:25pm
  •  bumapatria
  • Joined Aug 2011 | Status: Member | 10,724 Posts
Quoting the redlion
Disliked
it depends

it its in the direction of trend probably, but statistically i do not do well with breakouts, i do better with anticipating a change in direction at the distribution stage at loss of momentum

i have gotten burned by fake outs more often than not.

ideally i would have been in the trade already
Ignored
thanks for the reply -

as for mm - any opinion on stop loss at breakeven profit or profit stop lsoses? like +1 or +10 etc?

or a set stop where it just stays where it is and loss is loss eeven though u reaped profit? or would u be more likely to TP at loss of momentum going on ur favor?

and i assume ur stops are outside of volatility range means or at actual price levels? or both?


ADD: since u told me to be like water, i assume u apply similar mindset to that - so that would mean a flexible take profit target? since u cant forecast future from present position as u say and whatever happens next is what changes ur mind to ttry to decide what to do next? liek a dynamic TP?
(toanyone else with questions i hope im not robbing them )
Have I got something on my face, SOLDIER?
 
 
  • Post #34
  • Quote
  • Jan 7, 2012 3:29pm Jan 7, 2012 3:29pm
  •  the redlion
  • Joined Jan 2011 | Status: Member | 2,680 Posts
it all depends

i would move a stop loss only when i think it will not travel back up above open

i.e 80 pips below open, going back up and hitting my stop would be welcomed as this probably means a reversal, usually after 3 days of bearish movement or bullish movements.

as for TP depends if i am in position to ride the daily wave, example if monday i go long, and turns out is the beginning of a correction, then i will not tp however if i go short and the range is less than normal means loss of momentum i will tp and stay out.

depends on the risk at hand.

add: if i catch the top of the correction in the direction of the trend i would not tp AND would pyramid further into my position, but risking previous gains only so my risk would be 0%

as you can tell most of my trading centers on one idea (not the face please do not hit me in the face) lol
in other words i dont like losing money, i don't MIND making money but DEFINITELY DONT LIKE LOSING IT
AVT INVENIAM VIAM AVT FACIAM
 
 
  • Post #35
  • Quote
  • Jan 7, 2012 9:47pm Jan 7, 2012 9:47pm
  •  Chicky
  • Joined Sep 2008 | Status: Married - 5 Wives | 14,713 Posts
Marking my attandance. Will be watching with interest.
The Thief of Wall Street
 
 
  • Post #36
  • Quote
  • Jan 8, 2012 2:45am Jan 8, 2012 2:45am
  •  Bakuli
  • | Joined Jul 2007 | Status: Learner | 1,363 Posts
Subscribed !
 
 
  • Post #37
  • Quote
  • Jan 8, 2012 11:26pm Jan 8, 2012 11:26pm
  •  the redlion
  • Joined Jan 2011 | Status: Member | 2,680 Posts
i am out seeing patients at this moment but i have been eyeing the markets

Asian equities, Gold, Oil are all down, negative yields as well seems like risk off.

my best bet would be to continue this down move, no real show of momentum slowdown has happened yet, however i will not take a position at this moment, will await London, for better direction and entrance.

as you can tell we are trading below yesterdays low, and mostly below open with a rounded distribution pattern

Attached Image (click to enlarge)
Click to Enlarge

Name: asiansessionhourly.jpg
Size: 134 KB


Attached Image (click to enlarge)
Click to Enlarge

Name: asiansession.jpg
Size: 150 KB
AVT INVENIAM VIAM AVT FACIAM
 
 
  • Post #38
  • Quote
  • Jan 9, 2012 2:25am Jan 9, 2012 2:25am
  •  the redlion
  • Joined Jan 2011 | Status: Member | 2,680 Posts
it is 11:19 pm my time
4:19 pm Tokyo- ending their session
08:19am Frankfurt about to begin their day
07:20 London

our short set up, seems to be at an attractive level, however i will not be pulling the trigger just yet,

as you all know there are always two sides to every coin, after 3 days of bearish pressure a correction is technically expected, and to take it further we have been down trending with no significant upward move for months now.

however so far there is nothing as far as i know that can actually trigger any investor confidence in the Euro, Merkozy meet today which can be what is driving up expectations however short of monetizing the debt and seriously coming together towards a fiscal union i can only see disappointment in investors that will drive down the currency.

the level is there for a 1:3 leverage short, now lets see the weakness, before we go selling into an incoming train.
Attached Image (click to enlarge)
Click to Enlarge

Name: asiansessionhourly.jpg
Size: 164 KB


Attached Image (click to enlarge)
Click to Enlarge

Name: asiansession.jpg
Size: 133 KB
AVT INVENIAM VIAM AVT FACIAM
 
 
  • Post #39
  • Quote
  • Jan 9, 2012 3:13am Jan 9, 2012 3:13am
  •  the redlion
  • Joined Jan 2011 | Status: Member | 2,680 Posts
short implemented at 1.27523 the risk is minimal at 1:3 leverage
if i get stopped out that means is most likely a bullish correction start

only 15% has price moved above 61 pips from open and closed below open
and 84.58% has it closed below open when it does not reach >62 pips from open

however at this point it can very well be the start of a bullish correction, if in fact i do get stopped out i would await a better opportunity to long,

actually i got stopped out as i typed this..........so seems like its the start of a correction now, no sense in going long at this point there are always more opportunities later my loss was 0.90 cents
AVT INVENIAM VIAM AVT FACIAM
 
 
  • Post #40
  • Quote
  • Jan 9, 2012 3:27am Jan 9, 2012 3:27am
  •  the redlion
  • Joined Jan 2011 | Status: Member | 2,680 Posts
Attached Image (click to enlarge)
Click to Enlarge

Name: europesession.jpg
Size: 176 KB
AVT INVENIAM VIAM AVT FACIAM
 
 
  • Trading Journals
  • /
  • Red Lion on the hunt
  • Reply to Thread
    • 1 Page 2345 6
    • 1 Page 234 6
0 traders viewing now
  • More
Top of Page
Forex Factory Blog Updated: Alerting All Members
  • Facebook
  • Twitter
About FF
  • Mission
  • Products
  • User Guide
  • Media Kit
  • Blog
  • Contact
FF Products
  • Forums
  • Trades
  • Calendar
  • News
  • Market
  • Brokers
  • Trade Explorer
FF Website
  • Homepage
  • Search
  • Members
  • Report a Bug
Follow FF
  • Facebook
  • Twitter

FF Sister Sites:

  • Metals Mine
  • Energy EXCH
  • Crypto Craft

Forex Factory® is a brand of Fair Economy, Inc.

Terms of Service / ©2022