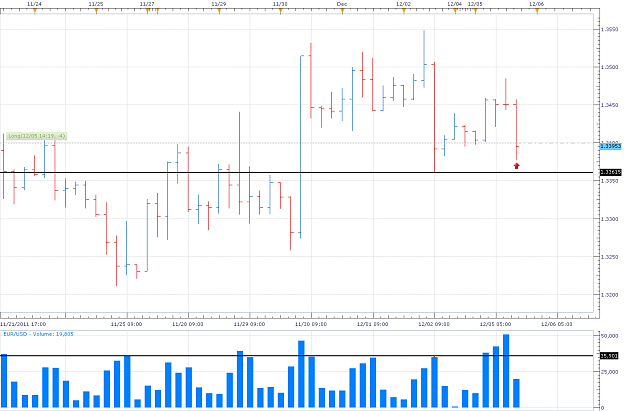
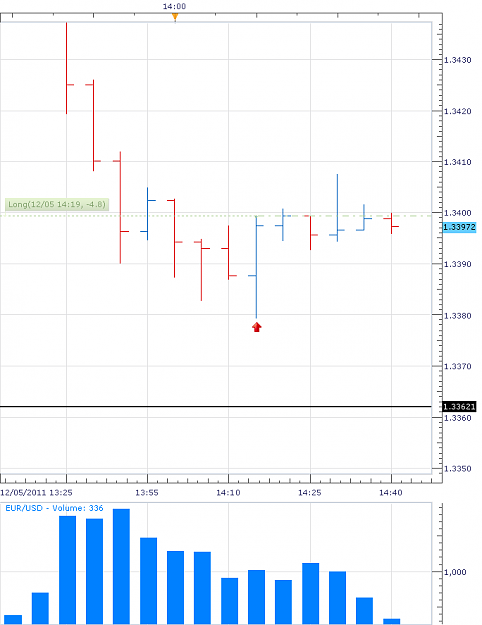
I took a long position, however from the video I clearly explain that the momentum is clearly pushing the pair higher,even if only temporarily. SM will always buy small orders to push prices higher so they can distribute more of there inventory.
A wide spread down bar on low volume, I mean come on talk about manipulation to reposition ones position boy sm really using the news today..I see manipulation is still alive and well..A quick check of the hourly shows this massive down bar is on lighter volume then the previous massive wide spread down bar. Sure sign of strength..
A wide spread down bar on low volume, I mean come on talk about manipulation to reposition ones position boy sm really using the news today..I see manipulation is still alive and well..A quick check of the hourly shows this massive down bar is on lighter volume then the previous massive wide spread down bar. Sure sign of strength..
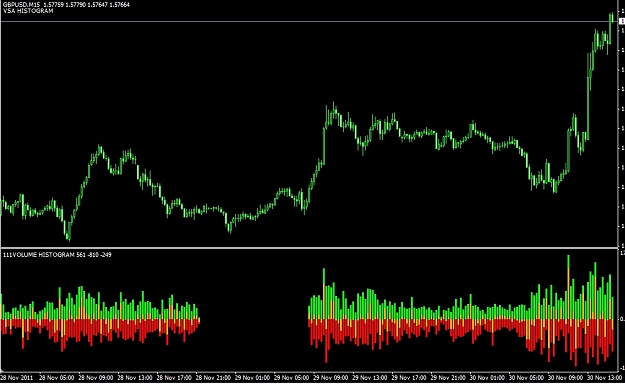
Took some trades in EURUSD and GBPJPY based on the VSA Methodology. I explain the EURUSD the reason the pair has faltered is because of the massive wide spread supply bar from 11/30 which has caused the pair to trade to the downside.This supply has to be removed before professionals can mark up prices again.They absorb the selling in a massive wide spread bar which is the highest since 11/30.
I was trading AUDUSD using 1HR/15M/5M charts and
...
...
Ignored
Hi Nyse82,
I started learning VSA in Nov 2011 and in the process, searched every nook & corners. I'm still a newbie in this concept. Found your old posts and found good info while reading thru them. Happy to see you started posting again!
I want to discuss equities (non-US) in accordance with vsa. Do you mind if I post couple of daily charts in here, my opinions and respective inputs and feedback?
I hope this would be a good learning experience for all.
Ignored
sure sounds good, I've been working for a private fund, so I haven't had the time to commit as much as I'd like but I think it would be great if you post..
sure sounds good, I've been working for a private fund, so I haven't had the time to commit as much as I'd like but I think it would be great if you post..
Ignored
Thanks buddy. I'll try best to post the daily (equity) charts with my (half baked) opinions on weekly basis. I prefer daily/weekly TF. Feedbacks, inputs & criticism are welcome from all. This is an attempt to learn vsa as time unfolds.
#1) Bottom reversal, vol higher than last 2 months. Sign of Strength.
#2) Kansas City Shuffle. Hit the brakes, reversed.
#3) High volume Up bar. Next bar is down. More selling. Sign of weakness. 2 bars ago, there was Up bar, small spread with low volume - No Demand??
#4) Higher vol in last 5 days. Brakes are hit again?? Close of next couple of days are clustering within the range of this bar although vol has not dried up completely. Whats going on?
#5) Clustering of close within thin price range, vol gradually reducing. Whats going on? Is this accumulation?
#6) Notice the divergence of price low and the RSI low.
How correct am I with my dissection? Am I missing something? Are they loading the boat (inventory) as we saw at #5??
Accompanied by the analysis above and info given (in attachmnt), what can be deduced?
Thanks buddy. I'll try best to post the daily (equity) charts with my (half baked) opinions on weekly basis. I prefer d
...
... Here's the first dissection: