Dislikedtyoon i am not sure why you find this difficult to grasp.
all you have done is plotted some math on one set of arbitrary CLOSE values, changed the timeframe, and then again tried to plot the same thing on absolutely guaranteed to be different CLOSE values again, compared the two and come to the conclusion that they don't align for some reason.
of course they don't. one is a 1H chart closing set of values and another the 4H chart closing values. they will rarely be the same peaks / troughs that you are using to derive this pointless magical...Ignored
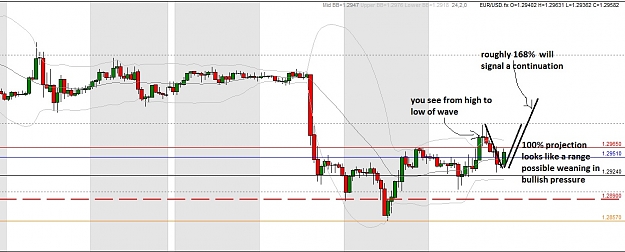
draw the fibs to gauge the retrace strength, do the math by hand.
most platforms formulas are never accurate in my opinion.
better yet, find out the actual retrace % is simple enough by excel, high-low= difference(lets call this difference X)
high-current= difference (y). y/x=z click the sell and convert to %, or simply convert it in your head.
AVT INVENIAM VIAM AVT FACIAM