6 color patterns to be added to a High/Low Range histogram
Will start with the first 4 patterns that are common,
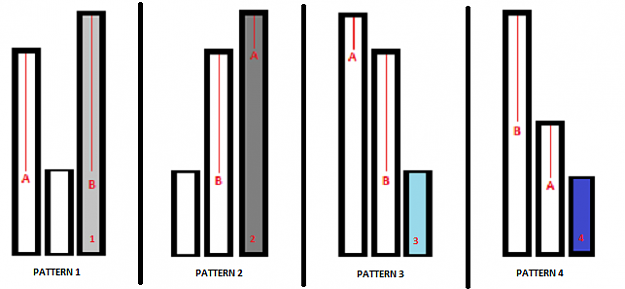
In the picture each number represents a different color. Each letter represents different lengths in the histogram's rate of change. There are 2 different lengths for this example,
Example 1
A= Short Length
B= Long Length
Pattern 1: Light Grey
A then B and the last closed bar is up
Pattern 2: Dark Grey
B then A and the last closed bar is up
Pattern 3: Light Blue
A then B and the last closed bar is down
Pattern 4: Dark Blue
B then A and the last closed bar is down
Example 2
Pattern 5: Yellow
The length of the rate of change is the same and the last closed bar is up
Pattern 6: Orange
The length of the rate of change is the same and the last closed bar is down
Will start with the first 4 patterns that are common,
In the picture each number represents a different color. Each letter represents different lengths in the histogram's rate of change. There are 2 different lengths for this example,
Example 1
A= Short Length
B= Long Length
Pattern 1: Light Grey
A then B and the last closed bar is up
Pattern 2: Dark Grey
B then A and the last closed bar is up
Pattern 3: Light Blue
A then B and the last closed bar is down
Pattern 4: Dark Blue
B then A and the last closed bar is down
Example 2
Pattern 5: Yellow
The length of the rate of change is the same and the last closed bar is up
Pattern 6: Orange
The length of the rate of change is the same and the last closed bar is down
Attached Image (click to enlarge)
Attached Image