Hi Fxgroup,
Thanks a lot for sharing a new way to identified buyer and seller.
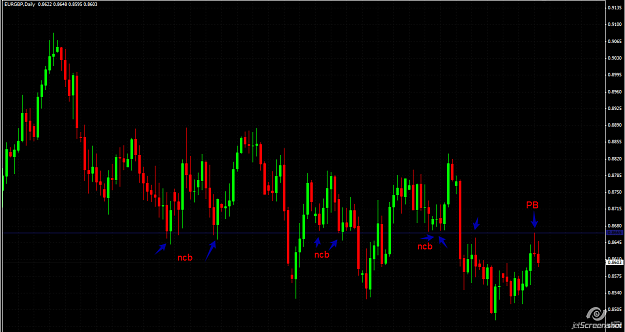
Can you advise how to determine the SnR level ? since I see you use the candle open and close. It is all candle or you have other specification to draw the SnR line in some candle.
Sorry for newbie question since I really no idea when to draw the SnR line
Thanks a lot.
Thanks a lot for sharing a new way to identified buyer and seller.
Can you advise how to determine the SnR level ? since I see you use the candle open and close. It is all candle or you have other specification to draw the SnR line in some candle.
Sorry for newbie question since I really no idea when to draw the SnR line
Thanks a lot.