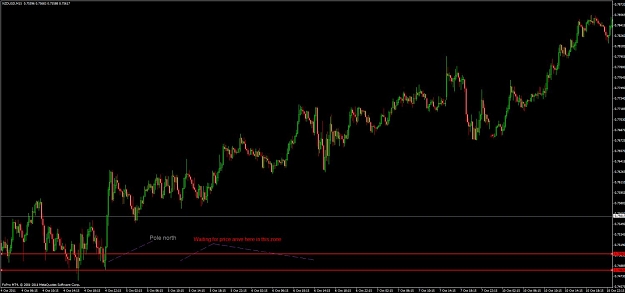
I pretty much always wait for a candle to close before entering a trade, so in this 4hr example (if I was trading off the 4hr) i would have waited for a close of the bar that retested the zone. If i decided to enter this trade (which I probably wouldnt) I would have had to put my stop below the low of the tail of the retest bar or to be safe below the low of the extreme low.
Clearly if I traded the touch and put my stop below the low of the zone i would have been taken out.
Spent the last two years using support and resistance LINES rather than S+D zones, taking a bit of time to adjust.
this is chat room built ( i belive) for sole purpose of sharing methods, analysis based on price action style trading. and i see it valid possiby on lower timeframes looks better cluster but really this thread i think If built it up for everyone to learn from one another.
great job keep it up
Ignored
Hi Buma,
Thanks but If was quicker and better so no need my post.
cheers
Krav.
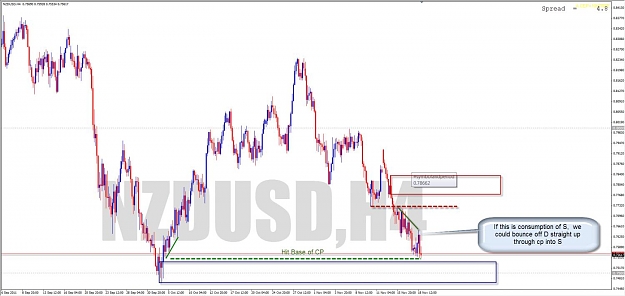
Hi, I've got a question about the nzd/usd chart.
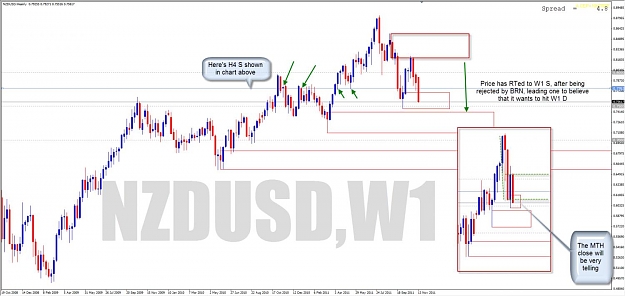
Logically we would follow the higher timeframes, which in this case would make the demand level on the daily chart invalid?
Since it already broke with a lower close on the weekly.
Could we see this as a probablity that the demand zone won't hold on lower timeframes?
Or should we still see this as price is still in the demand zone and keep focus on those smaller timeframes?
I think they were talking about this pair also on the james16 thread,
so not SD wise, they were also saying sell!...
Hi, I've got a question about the nzd/usd chart.
Logically we would follow the higher timeframes, which in this case would make the demand level on the daily chart invalid?
Since it already broke with a lower close on the weekly.
Could we see this as a probablity that the demand zone won't hold on lower timeframes?
Or should we still see this as price is still in the demand zone and keep focus on those smaller timeframes?
I think they were talking about this pair also on the james16 thread,
so not SD wise, they were also saying sell!
An...
Ignored
I think they were talking about this pair also on the james16 thread,
so not SD wise, they were also saying sell!
Hi mate,
I don't know what sayinf folks from J16 thread but I don't think they can see any sell signal on daily or weely.
Anyway we are still in demand zone so we can still go long if we will get buy signal in our demand zone.I found nice Demand zone on 15 min tf .
Only my view.
P.S. even from J16 style on daily is something like invertent pin bar IPB(not per definition) but signal bears loosing strenth and we had 5 days only bears so this facts can be for us like another conflounce.
Krav.
Hi, I've got a question about the nzd/usd chart.
Logically we would follow the higher timeframes, which in this case would make the demand level on the daily chart invalid?
Since it already broke with a lower close on the weekly.
Could we see this as a probablity that the demand zone won't hold on lower timeframes?
Or should we still see this as price is still in the demand zone and keep focus on those smaller timeframes?
I think they were talking about this pair also on the james16 thread,
so not SD wise, they were also saying sell!...
Ignored
I spent the last two years trading similar to j16, so i will give comment. (from a j16 point of view)
Personally i see no sell setup as of now on the daily chart. selling now is selling into support. For me i would like to see support at 7468 broken (convincingly) and then a rally back to it, to test it. If PA (pin bar, hikkake, or outside bar) indicates that the market is now respecting it as resistance I would short. you have to be aware of all the "snagging points" on the way down as it meets all the old s&r from the uptrend of the past 2 years.
its momentum vs s+r- if momentum is strong it will destroy s+r its up to you to weigh up all the information to come to a decision.
|
Joined May 2010
|
Status: No you don't.
|281 Posts
I wasn't sayin i'm looking to sell it from here, we missed the boat 3 days ago when it hit the fresh supply, as IF pointed.
The only thing i found confusing was the lower close on weekly and the daily bar close, isn't that an inverted hammer ?
I only just started reading the J16...
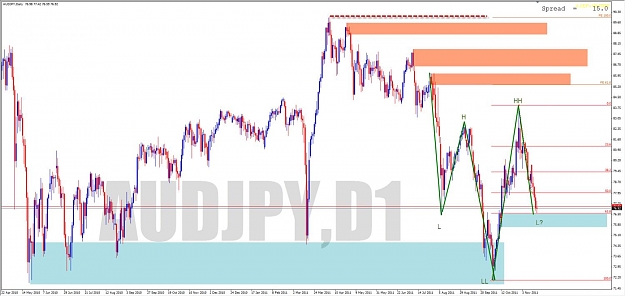
AJ ? looks like still going down but almost reaching minor demand level?
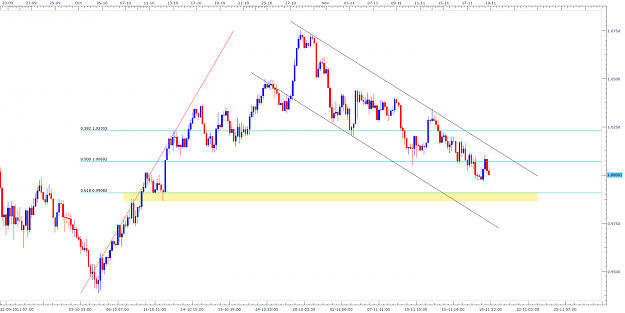
Looking at AU, price looks to be slowing down moving into the demand area which also coincides with the 0.618 Fib level.
I'm waiting for a bullish reversal pattern before entering.
Any advice/criticism will be appreciated on the entry and any other way of looking at it.
Thanks
Looking at AU, price looks to be slowing down moving into the demand area which also coincides with the 0.618 Fib level.
I'm waiting for a bullish reversal pattern before entering.
Any advice/criticism will be appreciated on the entry and any other way of looking at it.
Thanks
nice fosking im seeing similar things wih other analysis as well. i believe best thing to do wait for 9990s demand zone untouched and shoudl give a good reaction.
jsu a heads up not trying to create bias but my cycles on all tfs above m30 to daily and master charts show signs of bullishness on m30 and daily chart.
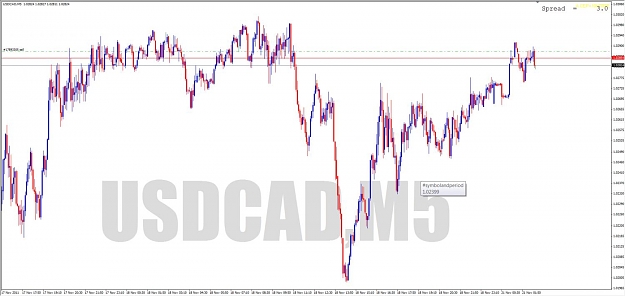
bullishd divergence on macd. i zoomed in in m5 to make things clearer
ADD: daily demand is touched and the move down i bet can be consumptive of supply and become compression to let price easily flow through. maybe...
i think aretest of the high made on the waves down can be something, but im seeing truncation already. no new lows if u see the chart. its in no wy a proper 50% retrace therefore perhaps momentum die out a bit and maybe we'll at least get retest of the high of the 'corrective' move down
Thanks If, most of my zones on this one are similar or the same as yours, one or two are different. I will watch both charts as the week unfolds. Thanks and good trades.
in the m5 chart, we see price rejection from supply and retested previous supply turned demand, and is now back in supply zone again. gap + huge bullish engulfing leaving that level so it may take a while to consume the demand there before the breakdown? i'm looking for bearish PA on h1 chart for trade signal
in the m5 chart, we see price rejection from supply and retested previous supply turned demand, and is now back in supply zone again. gap + huge bullish engulfing leaving that level so it may take a while to consume the demand there before the breakdown? i'm looking for bearish PA on h1 chart for trade signal
Only after they're closed, I'm sure, by dragging the ticket number from account history in terminal onto the chart
Ignored
Thanks
I was refering to the charts that people post here, hoping that the entry time is somewhere on the chart.
Without it, I find the post informative but it could be more so with the exact entry time for a reference.
I was refering to the charts that people post here, hoping that the entry time is somewhere on the chart.
Without it, I find the post informative but it could be more so with the exact entry time for a reference.
Gabe
Ignored
Nope. But keep reading back, and you'll spot the entries soon enough.