Thanks very much Bemac for your work on this system. I've found it to be an extraordinarily useful tool.
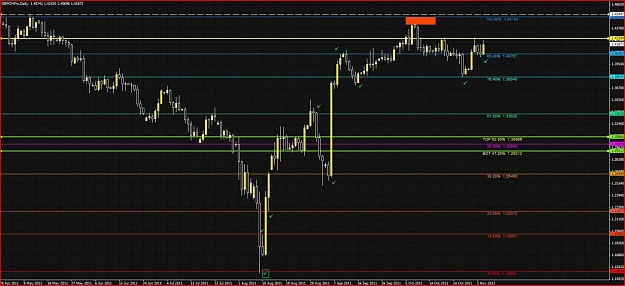
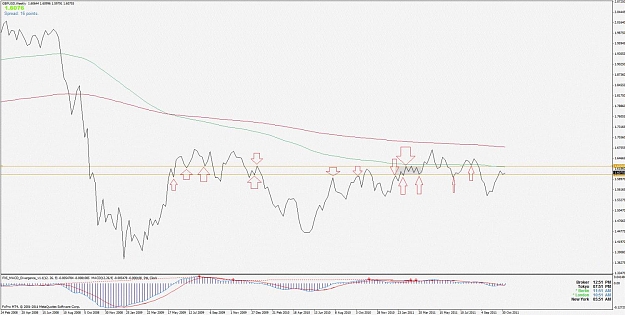
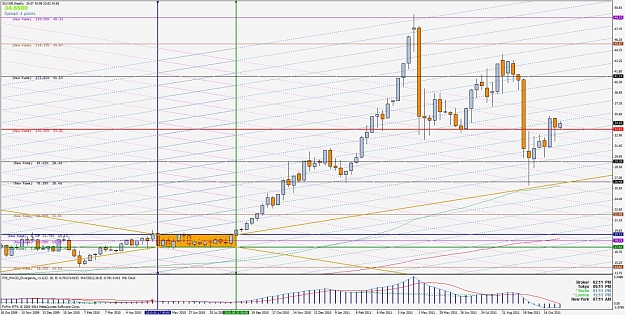
Here is my idea for GC.. Any comments greatly appreciated.
Can a successful system be reverse engineered? 14 replies
Order Flow Trading with ICCE Channels 3 replies
Fib. Reverse Engineered. 393 replies
Bemac's'imizing Profit 6 replies
VTTrader: Bemac help please 3 replies
DislikedForgive me for asking what may be a daft question, but isn't this giving almost exactly the same result as looking for PPZ and drawing those in manually?Ignored
DislikedSo you are drawing this on the daily TF, not going to the higher TF and working down?Ignored
DislikedPersonally I think that there is a subtle but nonetheless significant difference between the two methods. The difference in my opinion is that an ICCE box relates to the tempo (pips per time period) of the market that it is applied to. That is why the diagonals also act as PPZ's when they are aligned with the past price action.
Apart from that, I use the multiple levels to add a little more granularity, which can be useful if you missed an entry off of an ICCE level. They can also be useful if you want to drop down in timeframes...
Hi PB - Whilst...Ignored
Dislikedok, thanks for all the advice and responses.... i've tried to take in what you've written but now i cant see the wood for the trees..... I think i've found an area on EU daily which certainly picks out some significant areas.... whether it's 'right' or not i have no idea.
In fact, this leads me to thinking, Is there a right? I can see from experimenting that quite a few boxes will turn out different but significant ppz. Obviously there are 'wrongs' but how can i be sure i have drawn 'THE' box and not just 'A' box.
Here's my chart.... paint it...Ignored
DislikedOk I need to get braver at saying what I am doing and why because I would have loved for you to be saying that you did what I did (and more importantly that it worked ), instead of the other way around!!
I guess my having done it means I am at least learning something on repetition.
And why I am chicken I do not know, you are all so supportiveIgnored
DislikedI know. Anit that confusing when they all have information to offer.
I normaly find consolidation of PA by switching to a Line On Close Chart.
BIgnored
DislikedCheers.... that in itself is a great tip.
Are there any rules/guidelines to how many periods of info i should be looking to get into my box?
Also, when i'm looking to draw box on say weekly, when i drop down i lose the box plus all the fibs..... anyone know what i'm doing wrong?Ignored
DislikedDo we include the entry and exit bars of the consolidation area and do we use the higest and lowest close of that box?Ignored
DislikedWorks fine on my MT4 platform.
Which indicator are you using the grid or the J16 version?Ignored
DislikedDo we include the entry and exit bars of the consolidation area and do we use the higest and lowest close of that box?Ignored
DislikedI'm using the one at the beginning of Bemacs thread.... i've seen so many versions.... but a J16 version? not seen that one.
Acutally the box does stay on the chart but resets to a default position whenver i change TF. It doesn't stay in the range i specify on the higher TF......hmmmm, i'll fidlle about with it again.Ignored
DislikedI could be completely off track here, but I picture the boxes as more of a simple consolidation area in the past that results in fibs and trendlines that follow later price action.
You then use the resulting fibs and trendlines from the ICCE box as a guide to likely pa or pivot points for future price action around trades that you have entered using later entry criteria - I am not sure that the consolidation area needs to specifically qualify as a trading opportunity.
So I am thinking that the specific ICCE rules (if there are any) can be bent...Ignored
DislikedI wouldn't be so sure about that Cath.
I reconstructed one of Bemacs charts on silver that he posted.
The left vertical line is set at 2010/05/17 00:00 time
The Right vertical is set at 2010/08/30 00:00 time
The top horizontal is at 19.15
The bottom horizontal is at 17.42
Take a look at how Bill is using the highest close of resistance and the lowest close of support in consolidation area.Ignored