This is Daaaaaaan, the Fibonacci man
Attached Image
![]()
Attached Image
![]()
Attached Image
![]()
![]()
DislikedIgnored
Fundamental Analysis, Technical Analysis Or Graph Analysis? 28 replies
Best method/system to trade AUD/USD? 0 replies
Hedging AUD against USD - Any Good System? 0 replies
Anyone here trading AUD/USD or USD/AUD tonight regarding AUS Home Loan Report? 1 reply
The AUD/USD 1.00 EUR/AUD 1.60 GBP/AUD 2.00 Thread! 0 replies
This is Daaaaaaan, the Fibonacci man
Attached Image
![]()
Attached Image
![]()
Attached Image
![]()
![]()
DislikedIgnored
Lol!
Could you imagine the conversations that these two men could have had!
US OIL we done with, 220 pips from Oil, to the weekly target, baaaaaam, baaaaaaaaam
DislikedIgnored
Fibonacci Maaaaaaaaaaaaaaan, All trade calls Baaaaaaaaaaam, baaaaaaam, Baaaaaam. Big boys trades ![]()
![]()
Attached Image
Attached Image
DislikedIgnored
eur/usd, look for the beeb
Attached Image
Dislikedeur/usd
like mme always says, it is all fibonacci, fractals and the law of nature!
dan
Ignored
nasdaq up to 1256, 34 pointS shy of our target 1290,
Attached Image
Disliked
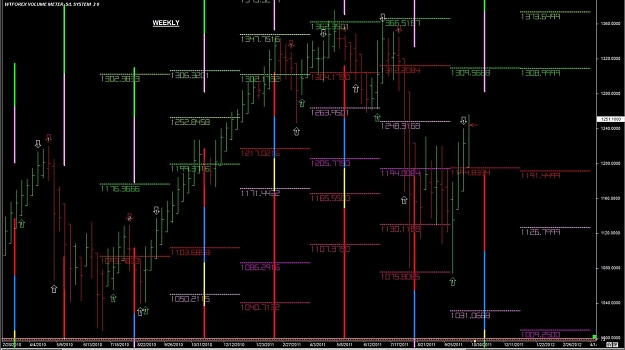
s&p500 dive today to 1073, breaking the low of 1080, looking at the daily chart this bearish move reached almost 1.618 of the ab leg a =1230, b =1129, c = 1220 and reach the extreme of the leg creating a bullish formation at d =1073, for this formation to be valid the area from 1129 to 1066 must hold and if this happen we will have a very good bullish run close 1290. Just keep in mind we did break a low ( major low ) the market can do what it wishes to do, we trade what we see. Good luck.
...Ignored
![]()
another nice call, Mme!
Gonefishin and Mr nature ![]()
![]()
![]()
Attached Image
Attached Image
Disliked[center]
Every time frame has its own Swings, Targets and Trouble areas. We analyze from the Large Time Frame down to the Small Time Frame. Even though we analyze from the Large Time Frame down to the Small, the Price Action moves from the Small Time Frame up to the Large. ALL OF THE TIME FRAMES ARE INTERTWINED. As the price action moves, it does so slithering like a snake walking its way up, down, or sideways. We always give more respect to the larger target support and resistance, targets or barriers.
EUR/JPY
Monthly...Ignored
Not much movement today...
Disliked[center]
GBP/JPY
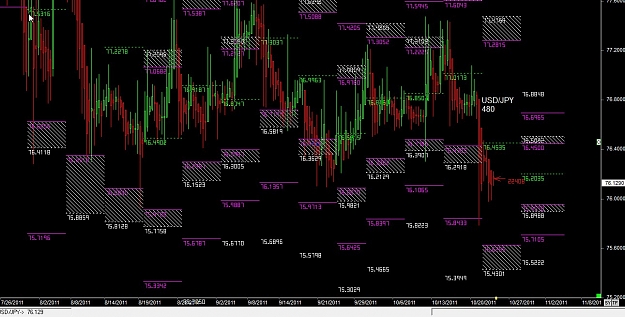
Monthly candle chart shows the yearly box has made a lower low, the current monthly candle is retracing at this point. We do now have enough candles (in the monthly chart) to plot any swings up, so we have to look to previous support/resistance.
Attachment
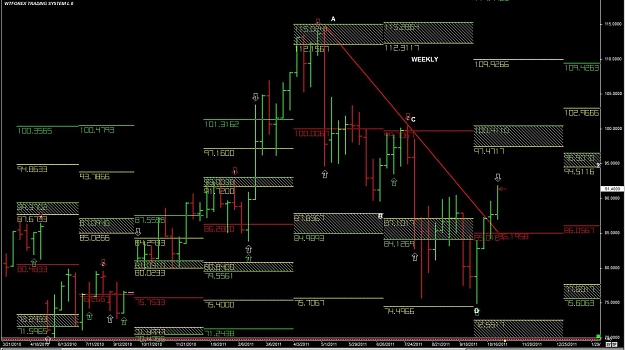
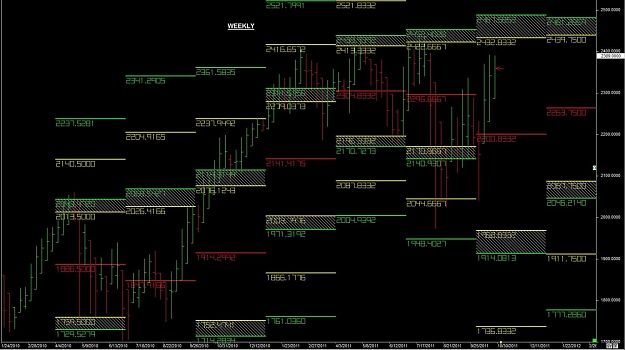
Weekly chart shows that we have completed the large swing down by reaching the full Target 2 (161.8). We have made a lower low, and currently sits above the Target 2.
Attachment
Daily chart shows the Monthly Hi/Lo's....Ignored
GBP/JPY
USD/JPY
Daaaaaaaaaaany Boy, Usd/Cad saying I know what you thinking, Dirty Harry style
Attached Image
Attached Image
http://www.forexfactory.com/attachme...7&d=1319064731
Watch Nasdaq, very close to the cluster f area, look at the daily chart, where ever it goes will go with it.
DislikedDaaaaaaaaaaany Boy, Usd/Cad saying I know what you thinking, Dirty Harry style
Attachment
http://www.forexfactory.com/attachme...7&d=1319064731
Ignored
Go ahead, make my day!
http://www.forexfactory.com/attachme...7&d=1319546735
http://www.forexfactory.com/attachme...4&d=1319540600
Dislikedwatch nasdaq, very close to the cluster f area, look at the daily chart, where ever it goes will go with it.
Attachment
...
http://www.forexfactory.com/attachme...7&d=1319064731Ignored
Dirty harry is dangerous man, be careful
Attached Image