What I believe is that there are many successful ways to trade, but far fewer successful ways to analyze. I am not one of those that believes Technical levels, in the Forex market, are hit by chance.
The occurance of the Fibonacci sequence in all of Nature is not a coincidence, nor is it a coincidence in this Forex Market.
Get Real, Get Fibbed!
EUR/USD
More technical...
Ignored
EUR/USD
WOW, what a week! Thanks for all the info this week Mme, the videos and also the calls...excellent!
Now, as we end the week, we get to see what story the candle close will tell...followed by the story that the new candle open will also tell. I can't wait!
WOW, what a week! Thanks for all the info this week Mme, the videos and also the calls...excellent!
Now, as we end the week, we get to see what story the candle close will tell...followed by the story that the new candle open will also tell. I can't wait!
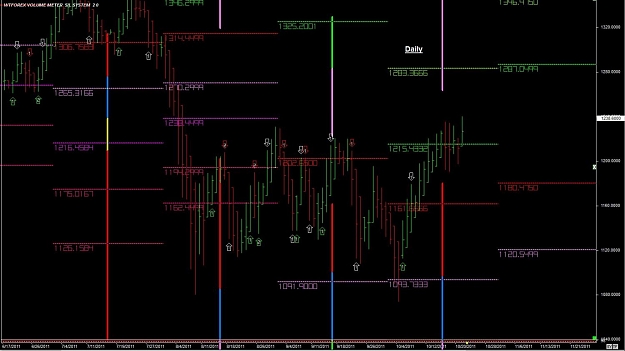
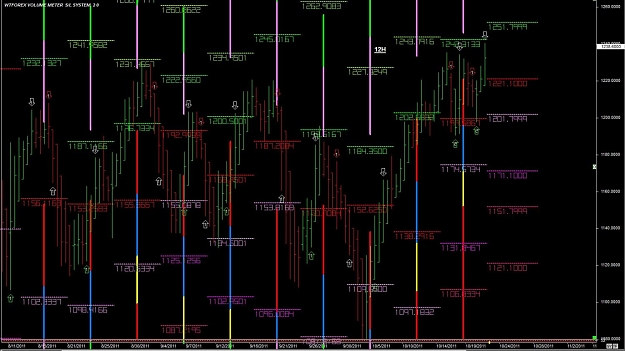
On october 4th, 2011 I have posted this one and anticipated the market will go to 1294 from 1073, and updates was posted during the period, today we reached as high as 1240, baaaaaaaaaam. Volume meter and Fibonacci don't lie, it is all there since the post, this one by itself is a 10 Million dollar trade.Baaaaaaaaaam. this is Big, huge boys trade, size 58.
S&P500 dive today to 1073, breaking the low of 1080, looking at the daily chart this bearish move reached almost 1.618 of the AB leg A =1230, B =1129, C = 1220 and reach the extreme of the leg creating a bullish formation at D =1073, for this formation to be valid the area from 1129 to 1066 must hold and if this happen we will have a very good bullish run close 1290. just keep in mind we did break a low ( major low ) the market can do what it wishes to do, we trade what we see. Good luck.
us dow, size 62 big, very big boys trade, above 11720, almost at the original target 11881, medics came according to fibonacci and the volume meter confirmation, baaaaaaaaaaaaam, this is very, very big boys trade.
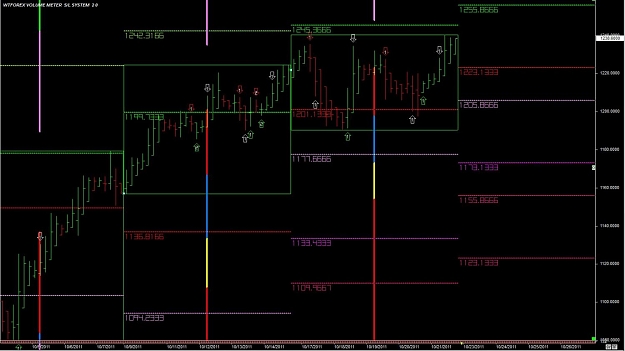
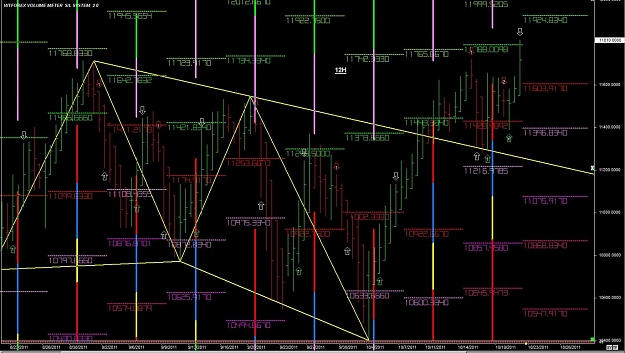
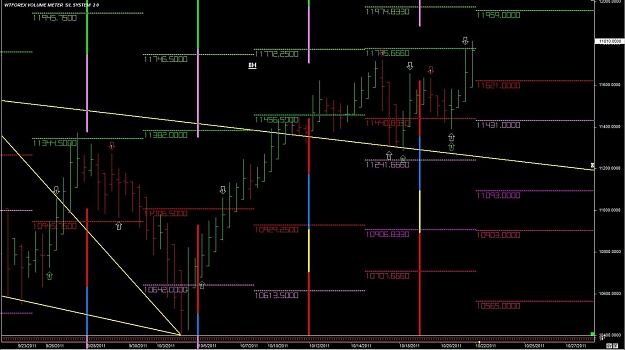
Every time frame has its own Swings, Targets and Trouble areas. We analyze from the Large Time Frame down to the Small Time Frame. Even though we analyze from the Large Time Frame down to the Small, the Price Action moves from the Small Time Frame up to the Large. ALL OF THE TIME FRAMES ARE INTERTWINED. As the price action moves, it does so slithering like a snake walking its way up, down, or sideways. We always give more respect to the larger target support and resistance, targets or barriers.
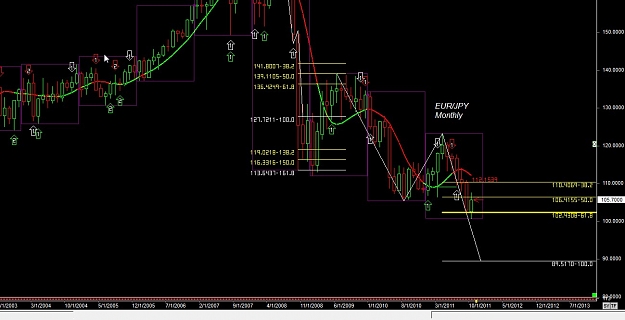
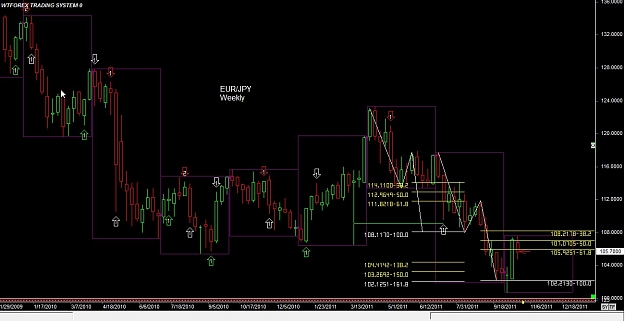
EUR/JPY
Monthly candle chart is showing lower lows and lower highs. It has recently made a lower low and is now retracing.
Attached Image (click to enlarge)
Weekly chart shows that the two different downswings have reached Full Target 2 (102.12) and Target 1 (102.21). Now it has been retracing. If these areas are broken, and we have new lows, we continue with our swing down. If these areas hold, we will have to wait. We will wait to see where a low forms (two to the right, two to the left). Once this happens we can start to plot out a possible swing going up. But this will take time...if you don't have it move to a smaller time frame or a different currency.
Attached Image (click to enlarge)
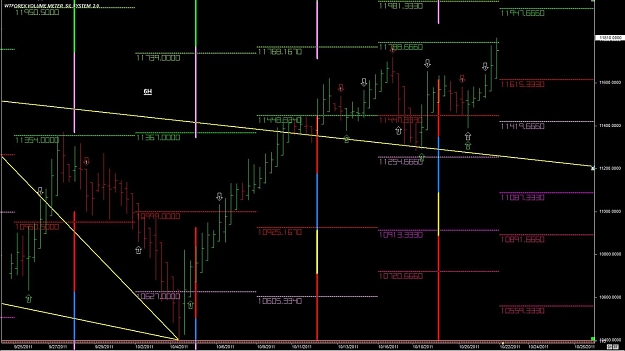
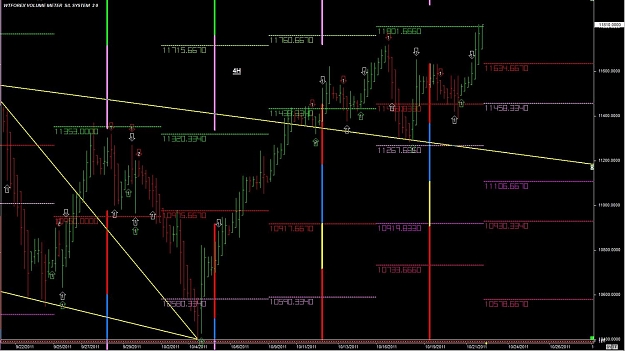
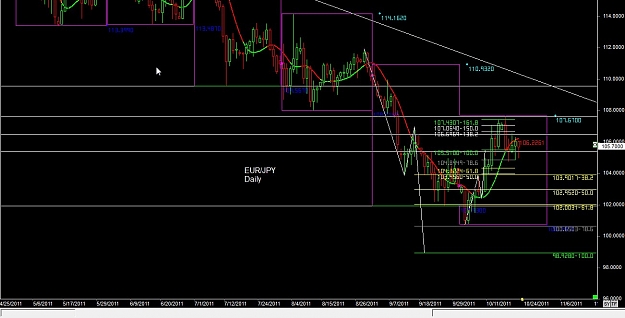
Daily is showing some Monthly highs and lows. It also shows the first small swing up has reached full target 2.
Attached Image (click to enlarge)
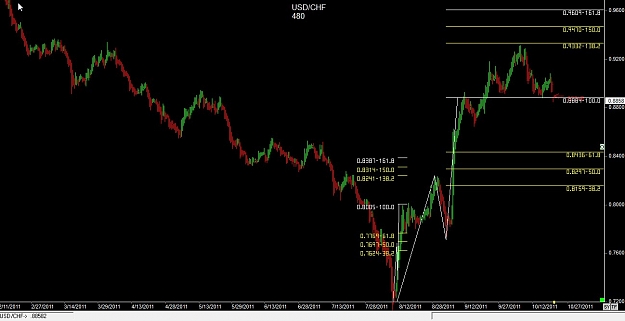
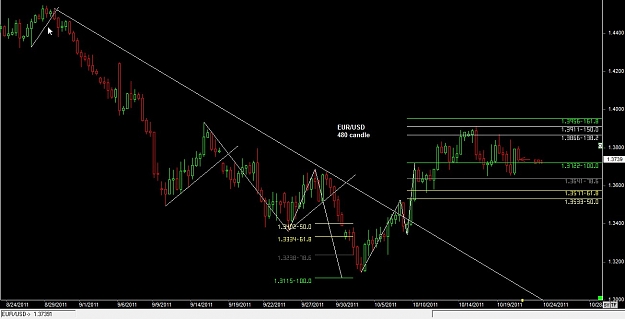
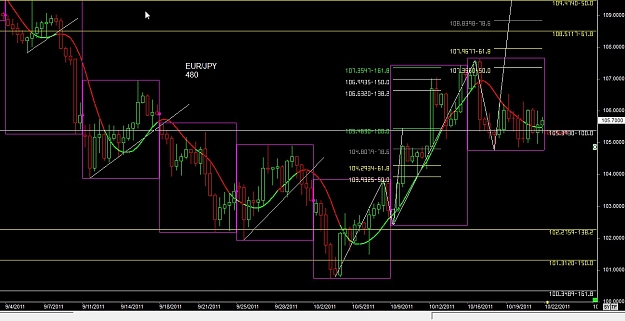
480 is showing the first small swing up complete to target 2 and the second swing up with barrier 61.8 and sub-barrier 78.6.
Monthly candle chart shows the yearly box has made a lower low, the current monthly candle is retracing at this point. We do now have enough candles (in the monthly chart) to plot any swings up, so we have to look to previous support/resistance.
Attached Image (click to enlarge)
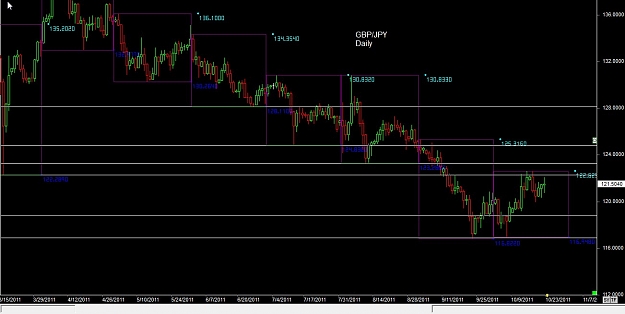
Weekly chart shows that we have completed the large swing down by reaching the full Target 2 (161.8). We have made a lower low, and currently sits above the Target 2.
Attached Image (click to enlarge)
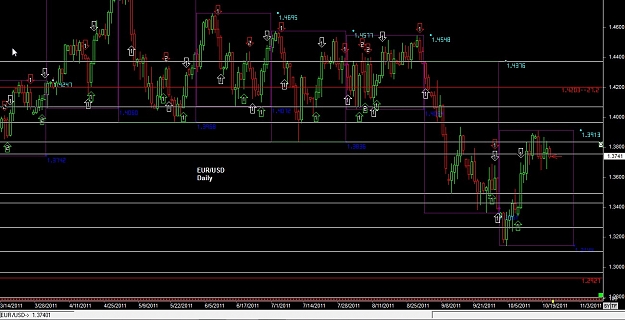
Daily chart shows the Monthly Hi/Lo's. We work things level by level.
Attached Image (click to enlarge)
480 chart has two swings going on. We have the Larger timeframe swing down, which has sub-target 138.2. After we hit a target, we need time to relax or retrace. After reaching the 138.2 Sub-Target we retraced up to the 100% Target 1, then we came down just short of the 138.2. Then we retraced to the 61.8 (barrier) of the Larger downswing.
Attached Image (click to enlarge)
We can also look at the smaller swing up. Any time we use the Dynamic Fib levels (not regular fib levels, which are also useful!) we plot out the A/B/C. Once this is done we get our levels. The 61.8 is a very strong barrier, if we break this level we often go to Target 1 (100%). The 78.6% is a sub-barrier, this sub-barrier is sometimes respected but not as strong as the 61.8% barrier.
We take things level by level! If we break a level and get a good candle open beyond the break, we can look to the next level to reach. After the barrier is broken (and sub-barrier busted) we look to our target 1 (100%). Again, this is a Target...so if you reach it, expect a possible retracement. Then wait and see what the candles are going to do next. Are they going to make a new high, above the previous break of the 100%? If so, wait for a good candle open above this point and then look for your entry (break a level, retrace). When you're moving past the 100% Target 1 you look toward your Sub-Target 138.2, 150 and Full Target 2 1.618.
Any time you reach a target, expect a possible retrace. So the action can look like this. We move up to the 61.8 barrier and find resistance, we retrace. We approach the 61.8 barrier and break it, having a open beyond it. Once you get the good open beyond the barrier look toward the Target 1 (100%) giving some exception to the 78.6% sub-barrier. Once the target 1 is hit you do the same thing to (and toward) the Sub-Targets and Full Target 2. Level by level...level by level...level by level.
Every time frame has it's own Swings, targets and Trouble areas. You give more respect to the larger Targets. Also, when a larger target is hit it is a more significant event (to the candles). So there may be a decent (either) retrace or consolidation period.
We analyze from the large Time frame down to the small. ALL the time frames are intertwined. The price moves through the small time frame toward the larger time frames. So why do we analyze from the large down, if the price moves from the small...up? Because we have to know the more important areas, the areas to give more respect to.
If we are approaching a monthly level, what is more important...the 240, Daily, or Monthly? The largest time frame of course. What if we have a quarterly level nearby? Then that gets the most respect with any smaller time frames. If we analyze from the small time frame up, we will not have the correct perspective!
Monthly candle chart shows the yearly box has made a lower low, the current monthly candle is retracing at this point. We do now have enough candles (in the monthly chart) to plot any swings up, so we have to look to previous support/resistance. Attachment
Weekly chart shows that we have completed the large swing down by reaching the full Target 2 (161.8). We have made a lower low, and currently sits above the Target 2. Attachment
monthly candle chart shows the yearly box has made a lower low, the current monthly candle is retracing at this point. We do now have enough candles (in the monthly chart) to plot any swings up, so we have to look to previous support/resistance. Attachment
weekly chart shows that we have completed the large swing down by reaching the full target 2 (161.8). We have made a lower low, and currently sits above the target 2. Attachment