Since last post on oct 4the, nasdaq found a bottom at 2040, since then the weekly chart has initiated a long entry with a target of 2073. Nasdaq has reached as high as 2032 40 point shy of the weekly target, i have not taken any trades on this one i did not pay any attention to it, what a shame that was an easy 300 poInts to make, we get the next one.
Since last post on oct 4the, nasdaq found a bottom at 2040, since then the weekly chart has initiated a long entry with a target of 2073. Nasdaq has reached as high as 2032 40 point shy of the weekly target, i have not taken any trades on this one i did not pay any attention to it, what a shame that was an easy 300 ponts to make, we get the next one.
Bubble bubble bubble, people have been calling a GOLD bubble since 1224. Every timeframe has it's own swings, it's own Targets, it's own trouble areas and it's own outlook. While one timeframe may be bullish another may be bearish...and the timeframes have to weave themselves together as they move.
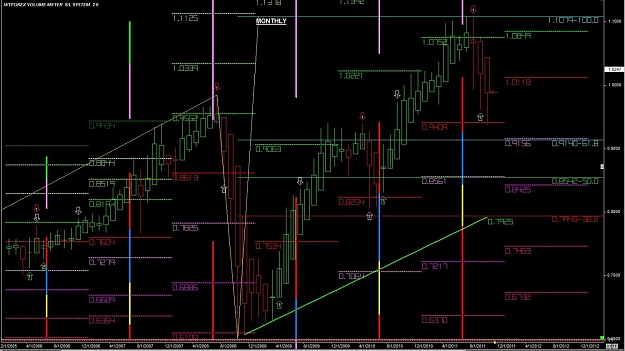
Monthly chart had made it's high reaching above the 1917 Sub Target 150%. After reaching the target it has been retracing short of the 100% Target1 (1505). Until we get an open below this point...
Ignored
Level by level. We hit a level, we take a break. If we hit a small level the break may be very short. Every time frame has its own swings, its own targets, its own trouble areas. Large time frame, small time frame...it is all the same.
You know what is funny Dan, Aussie since it reached .9386 has been making higher highs and higher lows, every day it goes higher they go short, next day goes higher the go short and they keep moving the stops higher and higher, they telling the market what to do. Baaaaaaaaaaam
us oil, first down swing complete, we have one target left, with the american greed session, God only know what they going to do.6 entries for good profit.
since last post on oct 4the, nasdaq found a bottom at 2040, since then the weekly chart has initiated a long entry with a target of 2073. Nasdaq has reached as high as 2032 40 point shy of the weekly target, i have not taken any trades on this one i did not pay any attention to it, what a shame that was an easy 300 points to make, we get the next one.
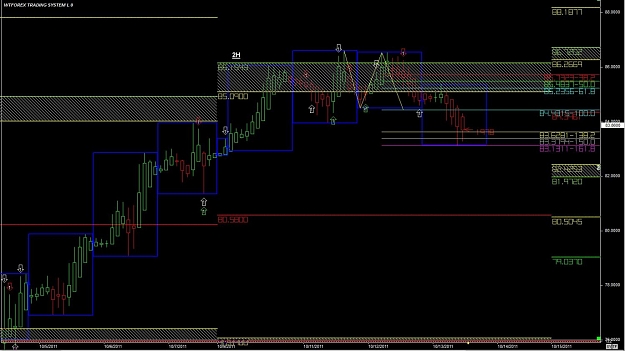
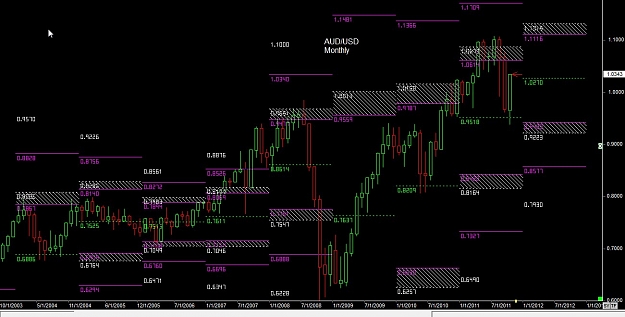
The Monthly chart is showing an uptrend with a retrace to .9386. 1.0270 is our area to watch to stay above/below in the Monthly chart. Remember that every timeframe has it's own Swings, Targets, Trouble areas.
Attached Image (click to enlarge)
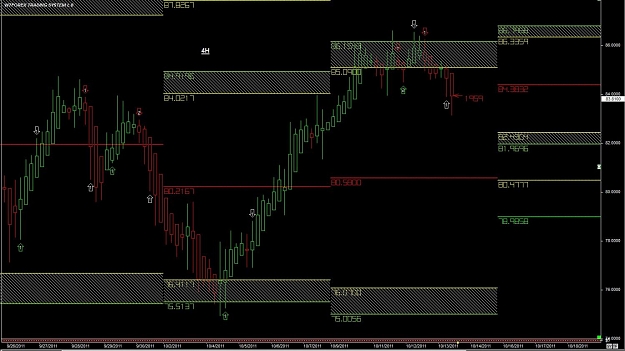
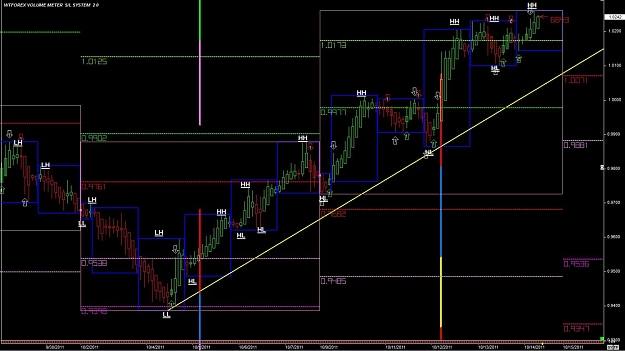
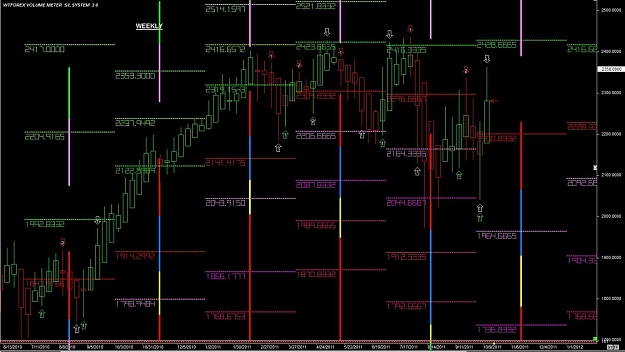
The Weekly chart is also in an uptrend, it has retraced down to the 100% Target 1 (.9610) but was unable to open below this point. We are now continuing back up, 1.0126 is the area we want to stay above to continue up.
Attached Image (click to enlarge)
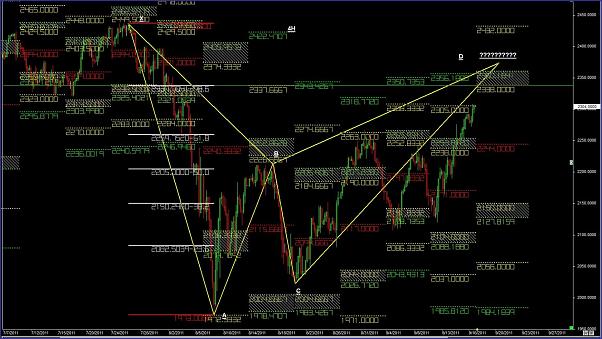
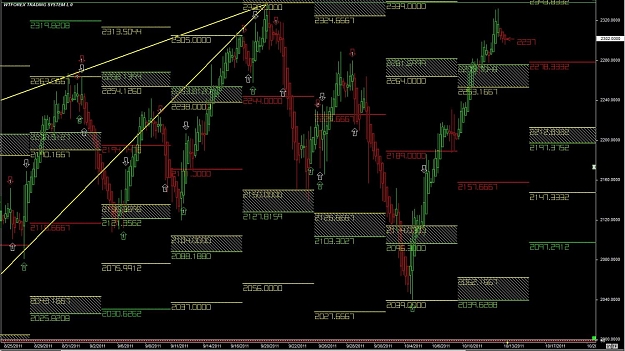
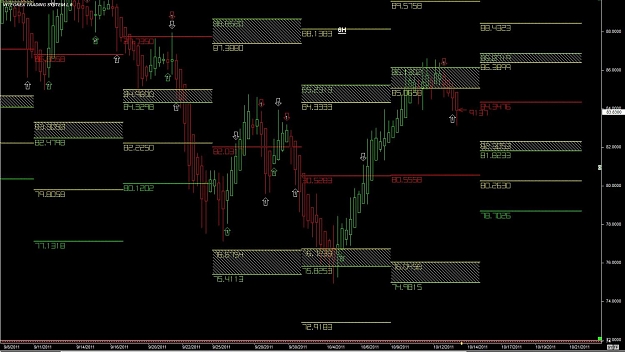
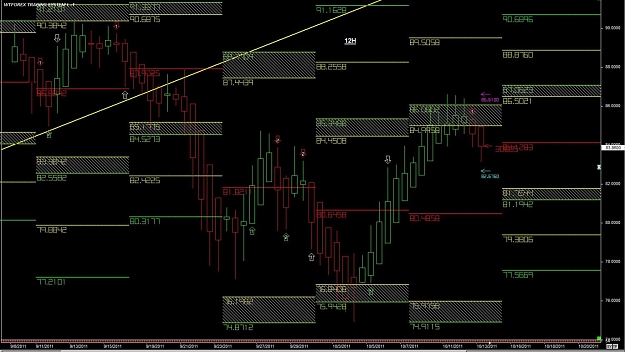
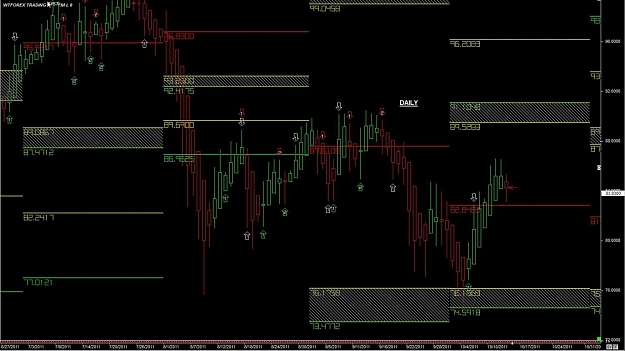
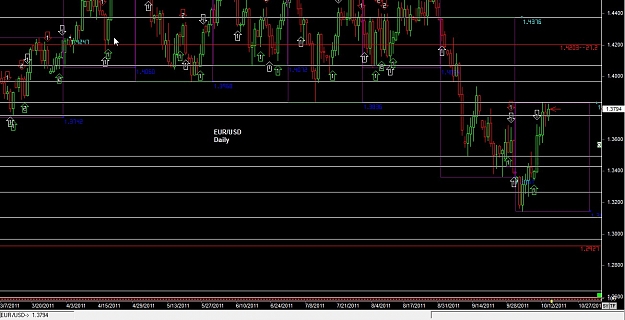
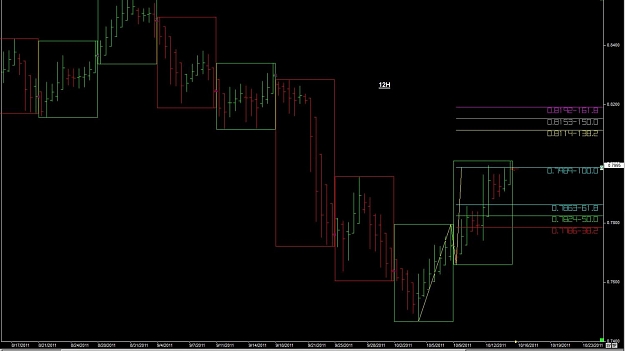
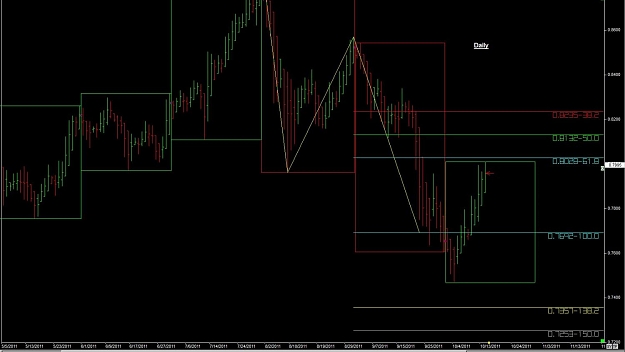
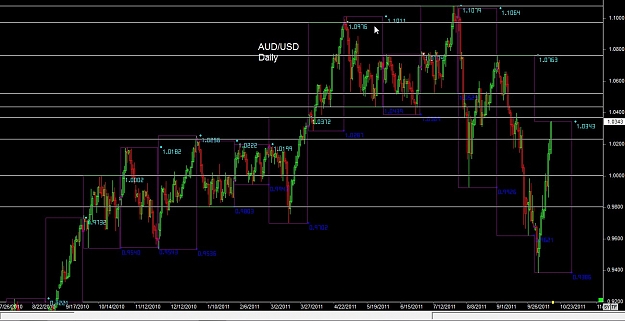
The Daily chart shows the Monthly Hi/Lo's. We work these areas level by level. break a level, retrace and head toward the next level in smaller swings. Just like in the past, if we stay above the 1.0524 area we have some nice big gaps to work.
Attached Image (click to enlarge)
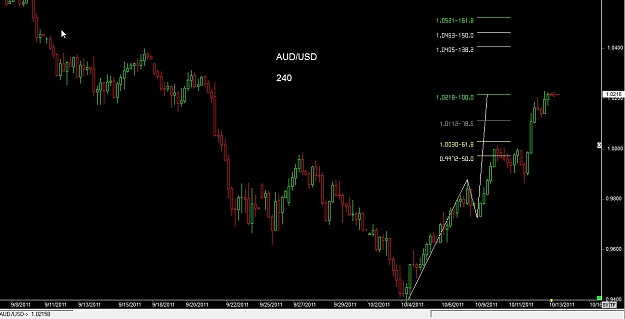
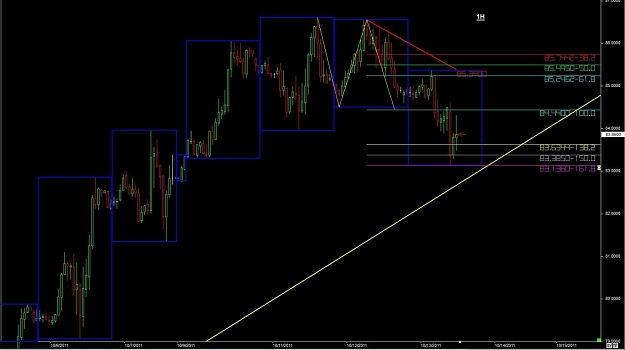
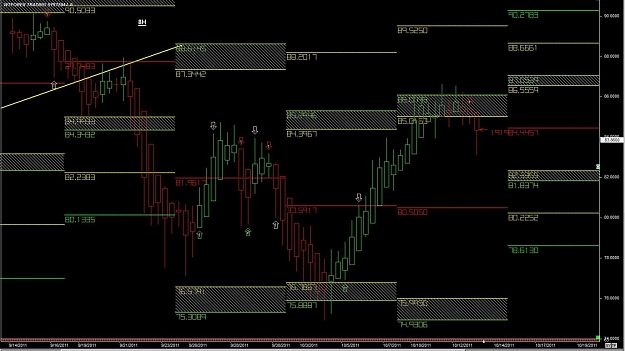
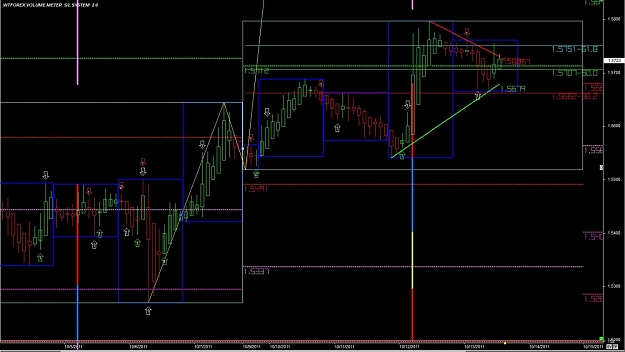
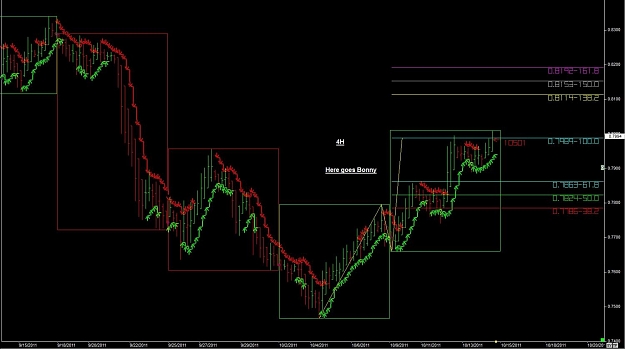
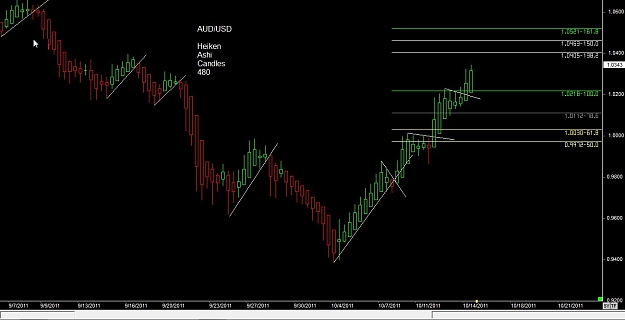
The 480 is showing a Heiken-Ashi candle. Here you can see the various counter-trendlines and the smaller swing up hit the 100% Target 1 (1.0218) and we are currently above it working toward the Sub_Target 138.2% (1.0405), after that we have the 150% Sub_Target (1.0463) and Full Target 2 161.8% (1.0521). Hmmm, Full Target 2 is 105.21...Funny, Have we seen that area before?
Attached Image (click to enlarge)
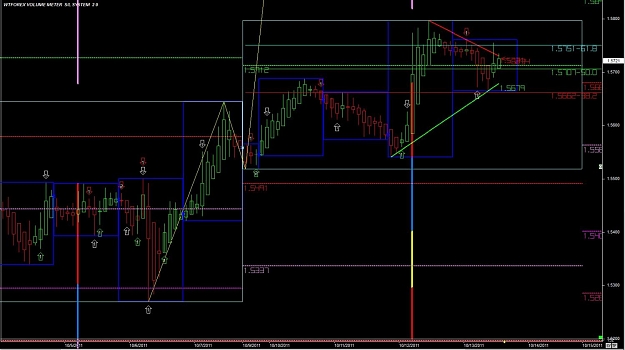
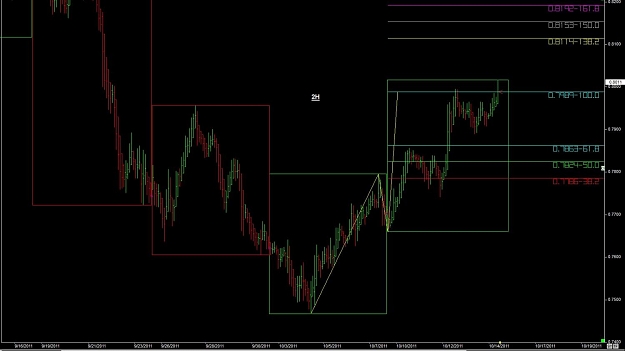
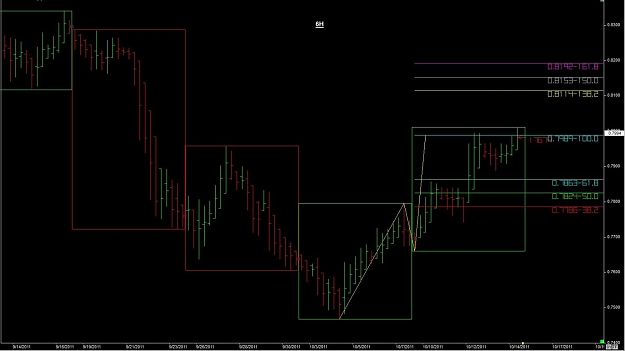
The 240 chart is showing one swing complete and the price has opened above the 61.8 barrier of the new 240 swing.