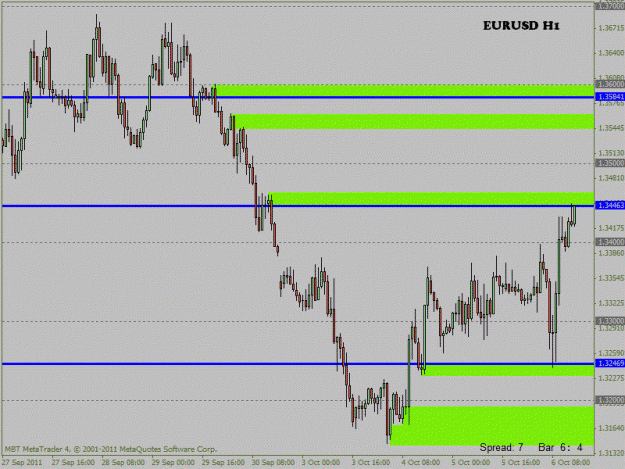
DislikedHi, if nawlins51 does not mind, I would like to use his chart for further discussion, in which Peter and Ken talked about this in early London today.
See chart below, there are 2 green levels highlighted, can I say the bottom one is only a "support" level then the later one is the real demand zone cos the price action after that is huge. So what we looking for, or we should put more weighting on is this real demand zone.
Dont know whether my concept is right.Ignored
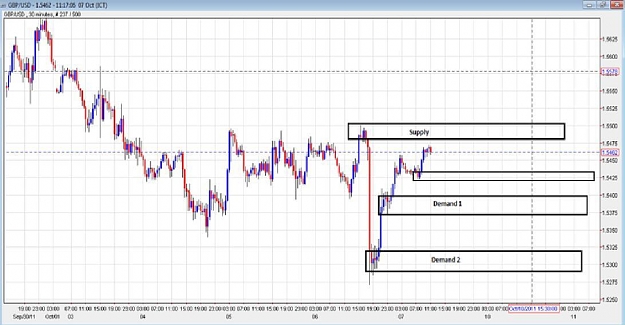
1. Too wicky.
2. Price traded in equilibrium for a while before taking off.
If I did take a trade, I would take one at the tip of the wick from the top level to the bottom of the bottom level as the zone. Still would be high risk.