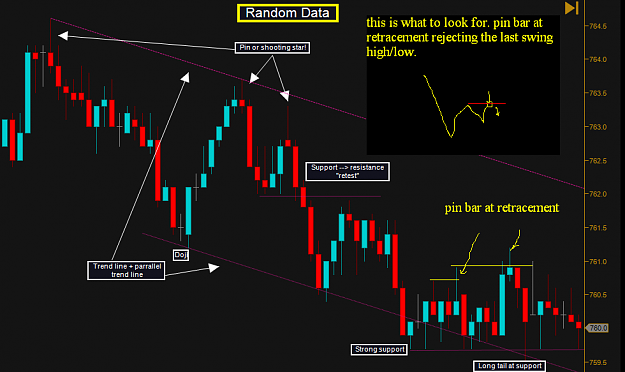
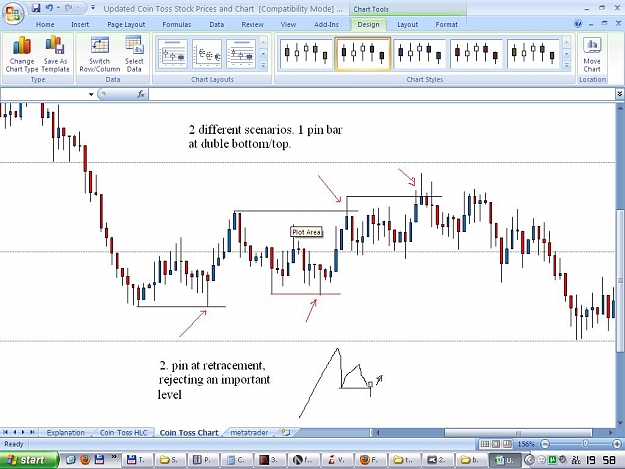
Below are reasons to suggest that trading using a TA-charting strategy may be just as good as entering randomly. In the Brownian motion charts below, entering ANYWHERE is a good entry if you're bullish. Every point in time has the same probability of going up.
I want to emphasize I did not do any excessive choosing. 3 of the graphs I selected were consecutive, and two graphs from there I chose were from a group of ~5. So in all, these are 5 graphs I've chosen to analyze from a group of ~8.
This doesn't logically disprove that charting doesn't work in the market, but it does raise a question.
http://i925.photobucket.com/albums/a...d%20TA/bm5.png
http://i925.photobucket.com/albums/a...d%20TA/bm4.png
http://i925.photobucket.com/albums/a...d%20TA/bm3.png
http://i925.photobucket.com/albums/a...d%20TA/bm2.png
http://i925.photobucket.com/albums/a...d%20TA/bm1.png