CFTC: FXCM To Pay Over $14.2 Million To Settle Charges
From efxnews.com
FXCM Inc. (FXCM) agreed to pay over $14.2 million to settle charges that the retail foreign-exchange brokerage didn't always offer clients the best exchange rates, the Commodity Futures Trading Commission said Monday. The $6 million fine and nearly $8.3 million in restitution to customers comes on top of a $2 million fine in August with the National Futures Association, an industry group. While the restitution comes out to about $17 per affected customer, the total settlement is relatively large for a CFTC action, and among the biggest ever for the NFA, analysts said. In a statement, the CFTC said FXCM failed ... (full story)
Each candle must tell a story of it's timeframe. We cannot get an idea of what that candle is trying to tell us unless we read ALL timeframes. We start with the largest timeframe first, the Monthly Candle timeframe. Then we go to the next timeframe, in this case the Weekly. We continue to do this looking the relationship between this new candle and the ones that came before it. We can apply various tools to help us get an idea of the story ahead.
While we analyze from the largest time frame to the smallest, the price movement starts in the smaller timeframe and moves up to the largest. This is why we must be patient. If we're looking for a larger timeframe target, we cannot take it until the entry is right. We must wait for the smaller timeframes to reach our entry. If it doesn't then we do not take a trade in that larger timeframe and we work in a timeframe that we do have an entry in.
We cannot tell the market where to go, but we can read what it is trying to tell us. What is this new Monthly candle doing in relationship? What is the new Weekly candle doing? Etc.
EUR/USD 480
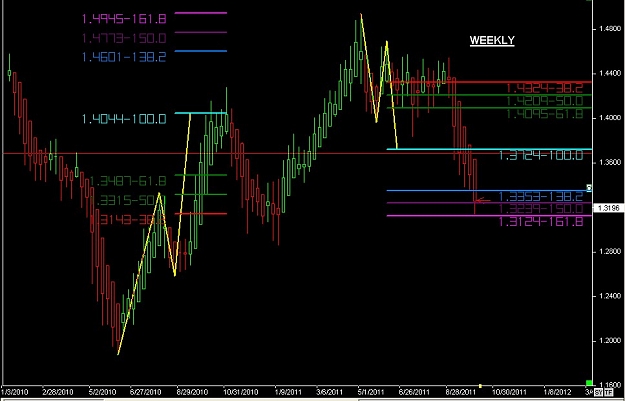
Here is a larger swing added in the chart, notice how the Full Target 2 of the smaller (current) swing matches up with the 100% Target 1 of the larger swing.
Attached Image (click to enlarge)
EUR/USD 480
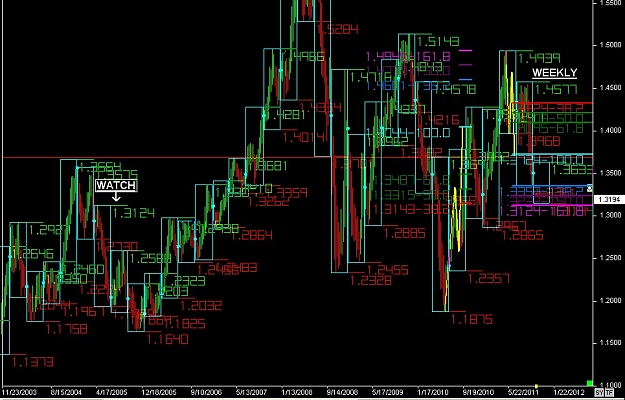
Why not add another chart in the 480. Here we get a bigger picture of what we have, have had, and may have.
Monthly done and gone With Bernanke 400B, he shorted Gbp and The Euro,and focused on the smaller time frame for price action and next move, way to go Ben
EUR/USD 480
Here is a larger swing added in the chart, notice how the Full Target 2 of the smaller (current) swing matches up with the 100% Target 1 of the larger swing.