UBS Media Release: $2B Trading Loss due to Unauthorized Trading
From ubs.com
UBS has discovered a loss due to unauthorized trading by a trader in its Investment Bank. The matter is still being investigated, but UBS's current estimate of the loss on the trades is in the range of USD 2 billion. It is possible that this could lead UBS to report a loss for the third quarter of 2011. No client positions were affected.
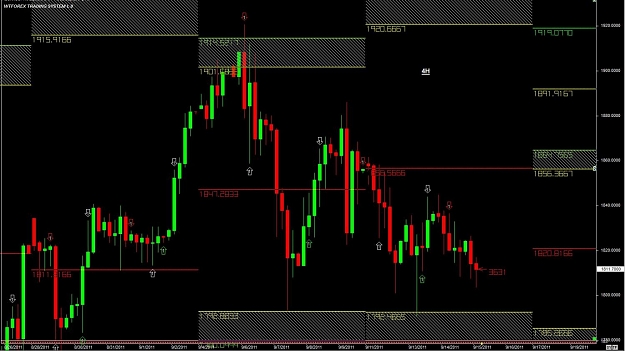
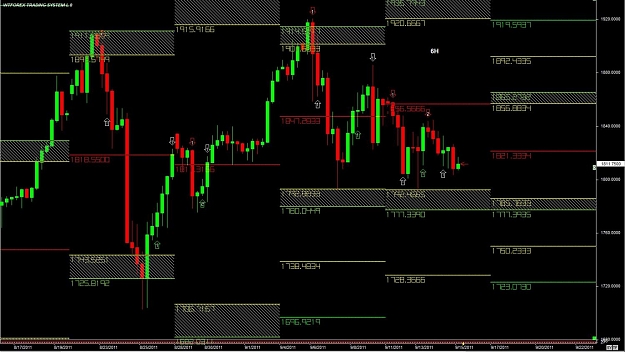
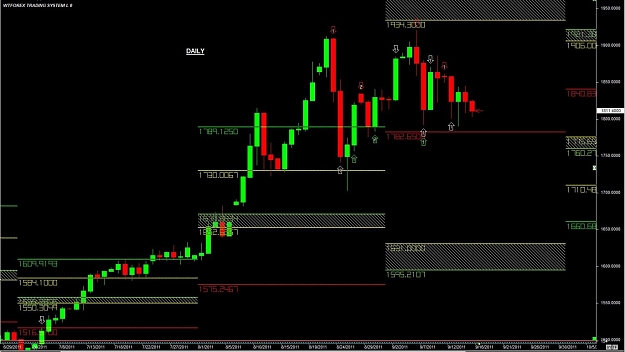
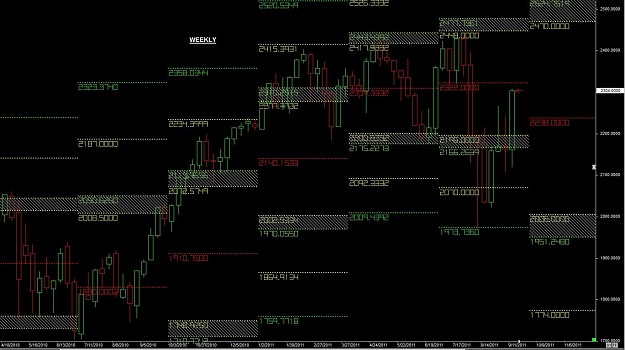
Looking for support first in the Weekly at 1815, 480 at 1781 then 240 at 1765. We still have the Weekly (1944) and Monthly (2014) Targets to reach. Like usual, any swing will start in the smaller timeframe and walk upwards to the target. Targets can change at any time if support is not met.
Looking for support first in the Weekly at 1815, 480 at 1781 then 240 at 1765. We still have the Weekly (1944) and Monthly (2014) Targets to reach. Like usual, any swing will start in the smaller timeframe and walk upwards to the target. Targets can change at any time if support is not met.
We hit 1765, now it's time for a retrace. If we find support at 1765 and close above 1792/96 I'll continue to look at swings to the upside, and to the downside.
If we go down below 1765 we have support at 1757. If we hit this area and close below/between the 1777&1792/96 or lower I'll be anxious to see next weeks open as I'll be looking closer at further swings to the downside.
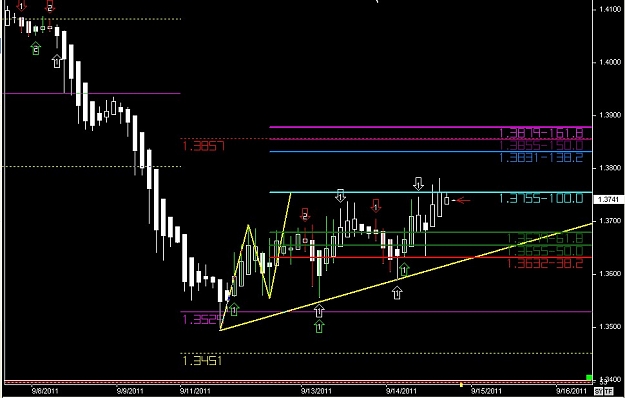
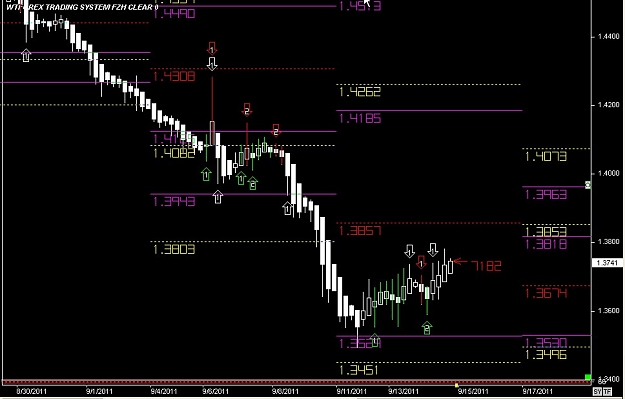
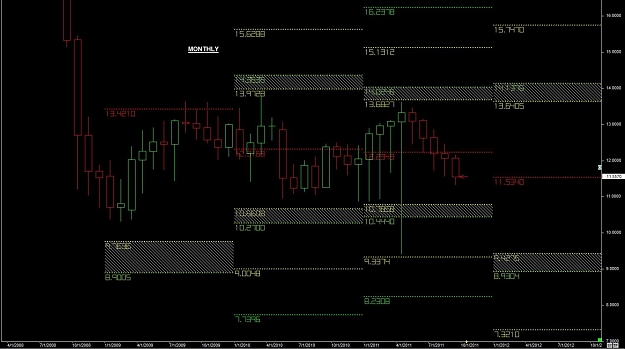
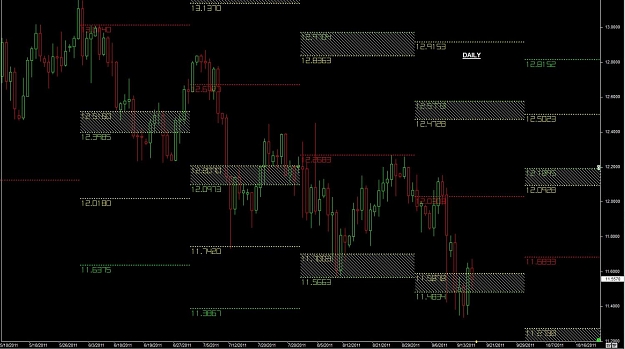
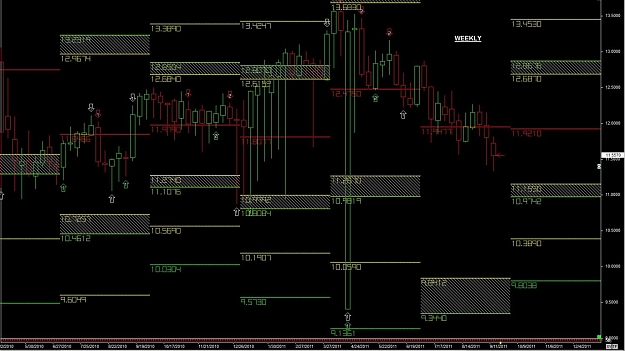
Monthly shows we had reached the full target 1.0471 and has been ranging since then. During this time we have been hitting lower highs.
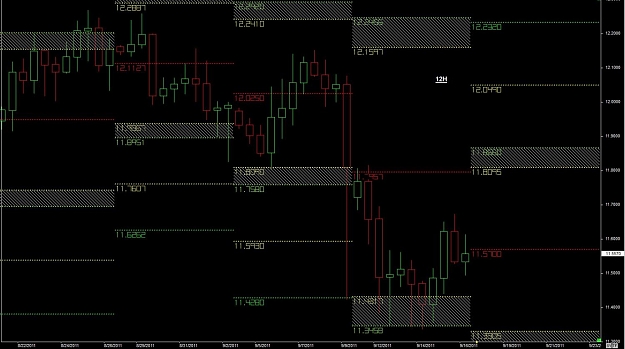
The Weekly chart shows a slightly different swing. This one has us reaching the 138.2 sub-target and the 150.0 sub-target, then it re-traced down to the 100% first Target, 1.0097.
The Daily shows a nice gap, should it go up, from 1.0233 and 1.0444. You can see the other levels (up/down) in this chart as well.
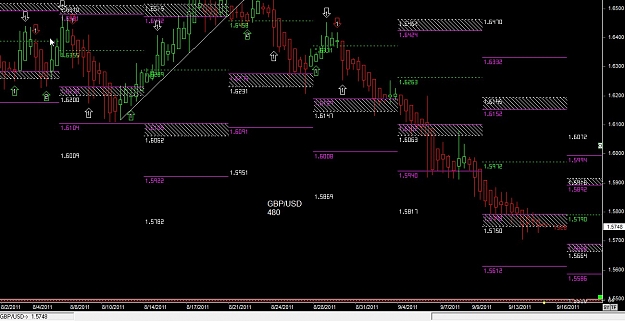
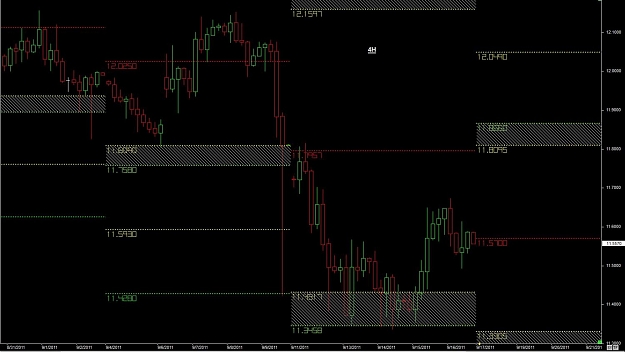
480 shows the Fibonacci Zones
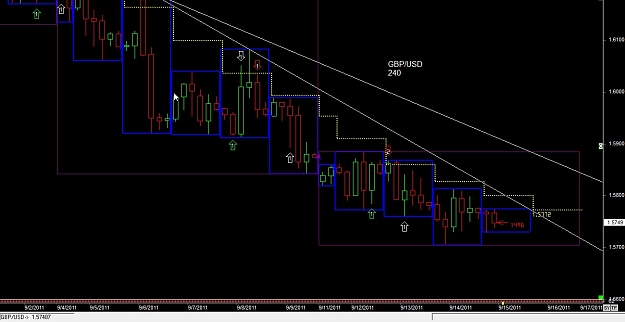
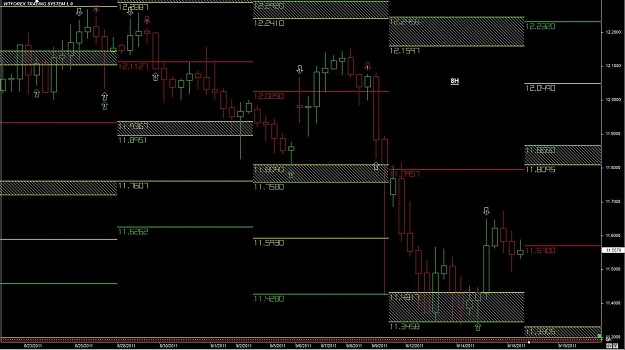
240 shows two different swings down, one is slightly larger than the other. Target 1 of both swings have been met. Big areas to watch are 1.0100, if we open below this area look to the next sub-target 1.002, .9972, and .9941. You can find these areas in the other timeframes as well.
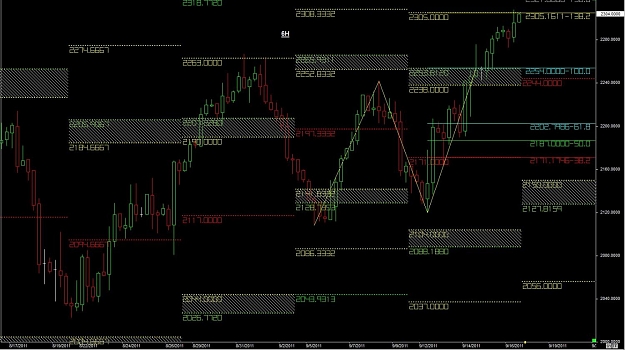
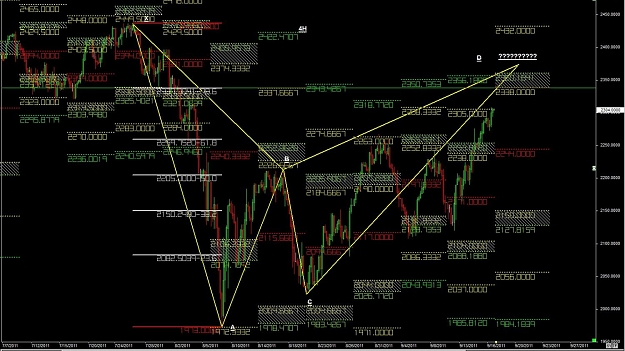
Since the dive to 1973, NASDAQ came up big, now at 2304 and looking to go higher. the eye should be on the area of 2356-2371, the .786 of Fibonacci retracement and the last barrier to hold the up move. The daily chart has a Gartley down move and the ABCD retracement still active to (.786) 2356-2371, the way the market re-acting is pushing itself to .786 before FMOC announcement on Wednesday. If you you trading the NASDAQ keep an eye on this area and watch the market behavior at this level.We above the 100% next area to watch is 2356 to the upside and 2264 to the downside.
US OIL
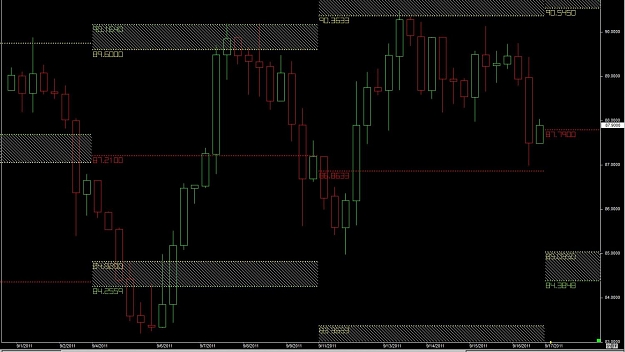
The bearish formation on the Daily chart ended at $75.68 before $75.38 our target last month, it was a very good run down, since then the market has formed a bullish Gartley on the 4H chart. We at $87.90 as of this writing, now we have to watch this formation to continue as long as $85.77 is holding the down move on the 4H chart. New week starting, new swing will be forming. hoping for a good run again